|
|
|
|
Data-driven time-frequency analysis of seismic data using non-stationary Prony method |
Next: Field examples Up: EXAMPLES Previous: EXAMPLES
|
|
|
|
Data-driven time-frequency analysis of seismic data using non-stationary Prony method |
|
|---|
|
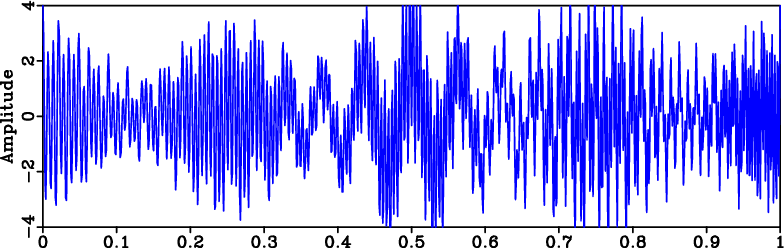
hsig
Figure 1. Synthetic signal. |
|
|
|
|---|
|
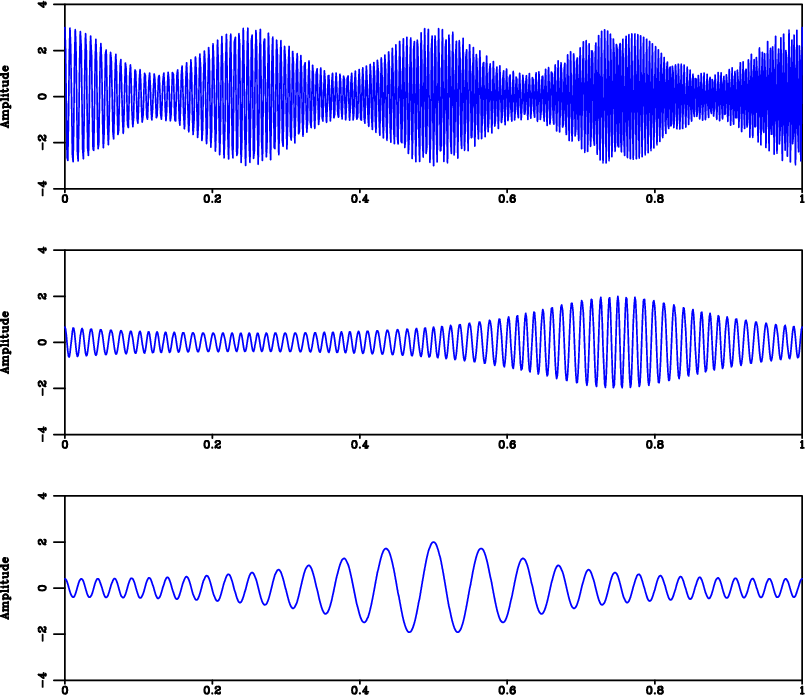
sigs
Figure 2. Components of the synthetic signal of Figure 1 . |
|
|
|
|---|
|
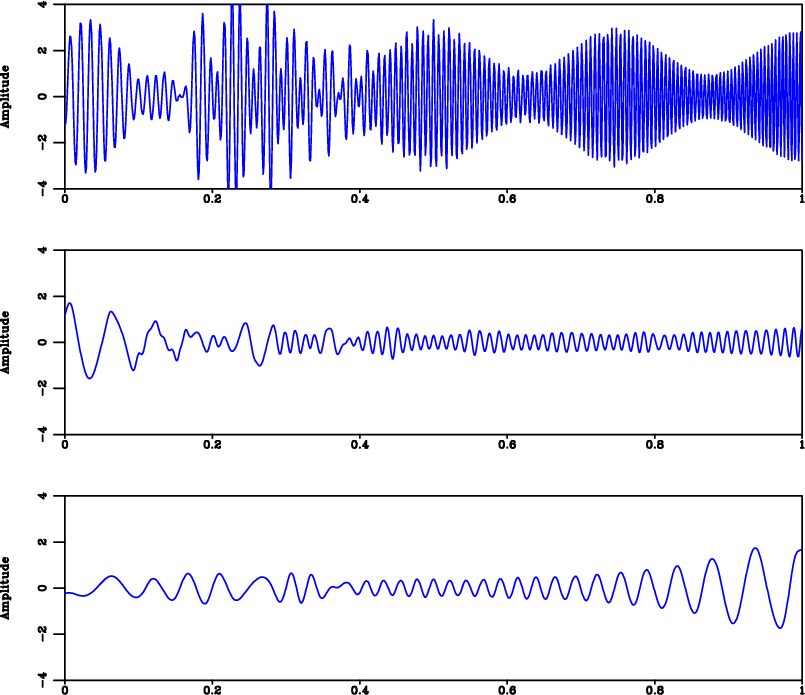
emd
Figure 3. Components of the synthetic signal of Figure 1 using ensemble empirical mode decomposition. |
|
|
|
|---|
|
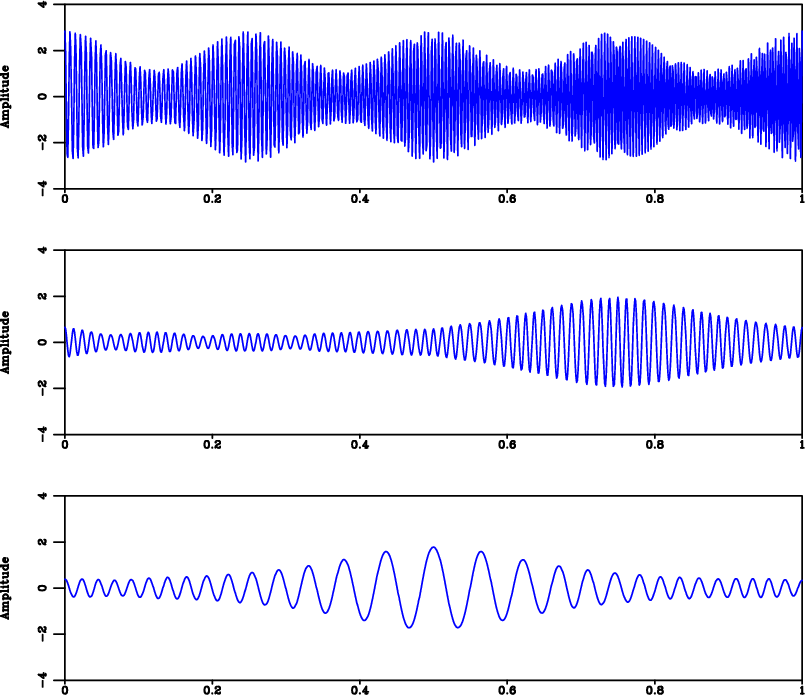
nar
Figure 4. Components of the synthetic signal of Figure 1 using NPM. |
|
|
|
|---|
|
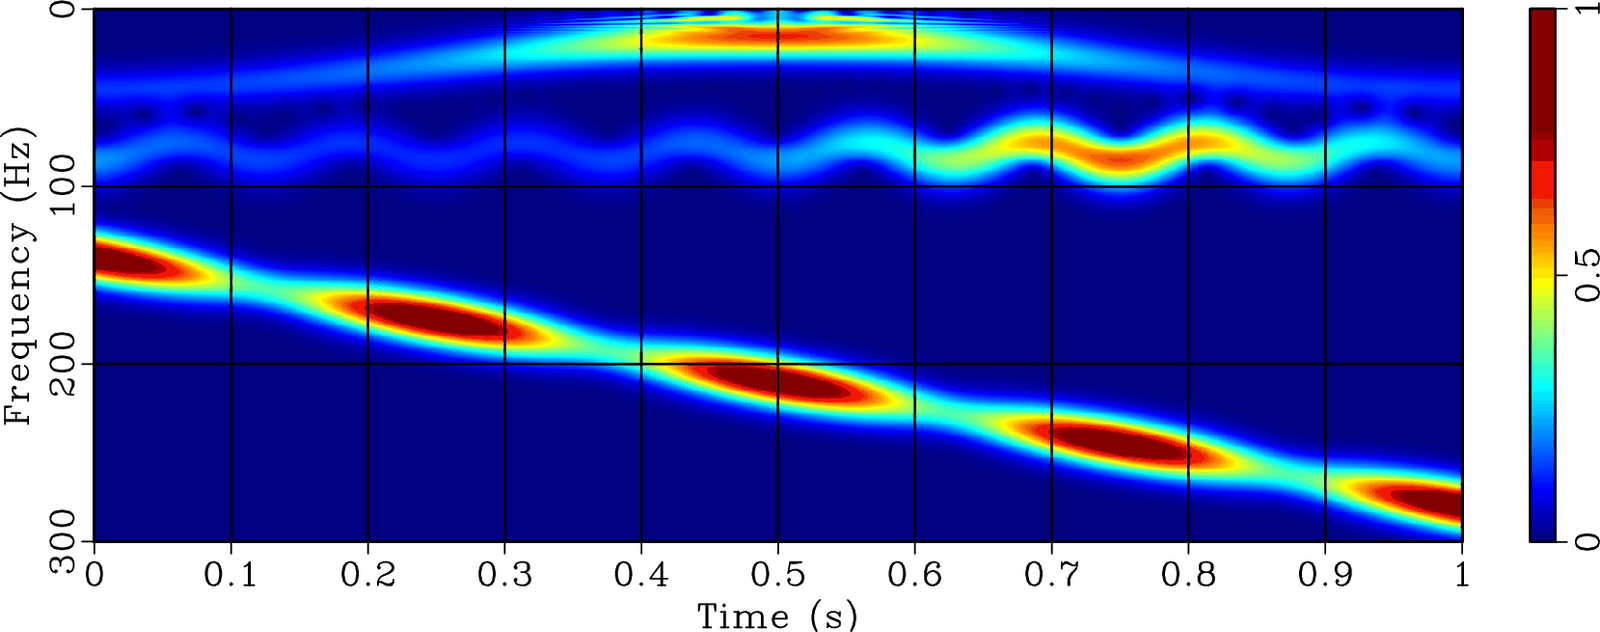
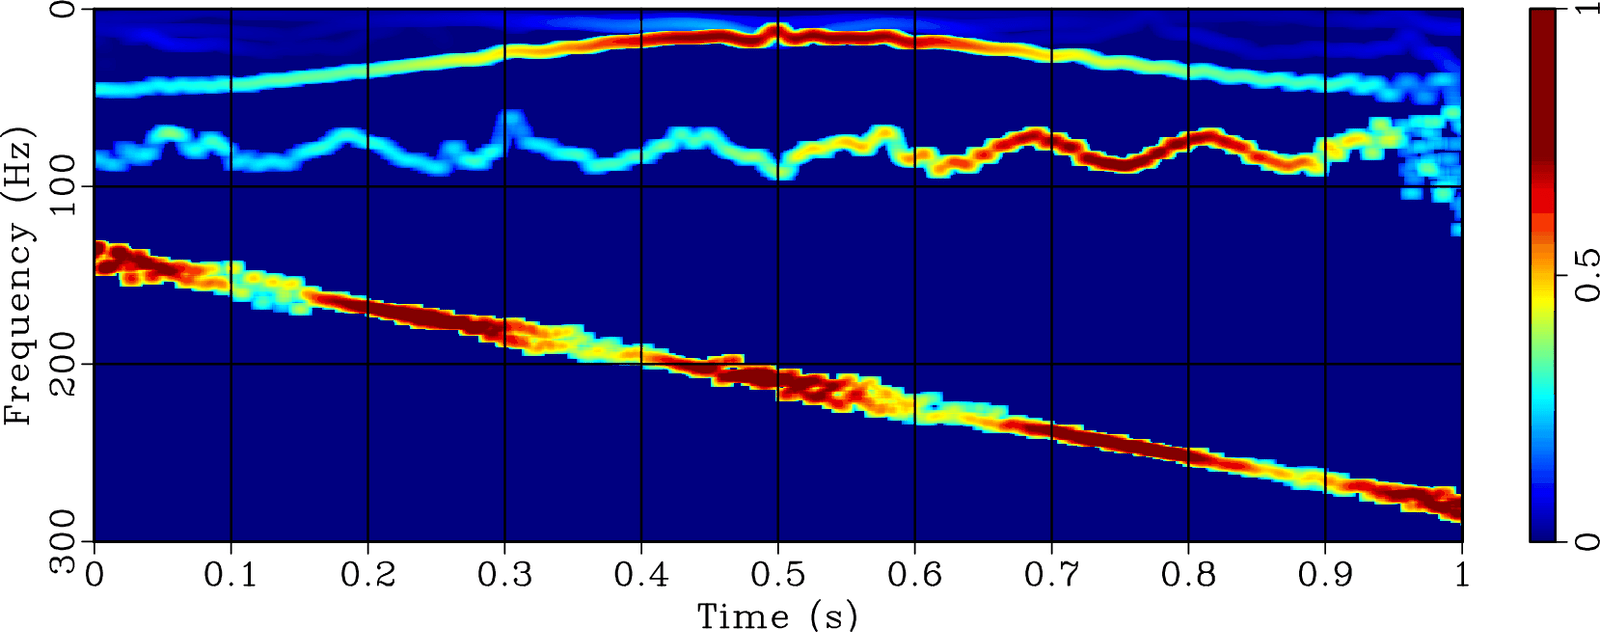
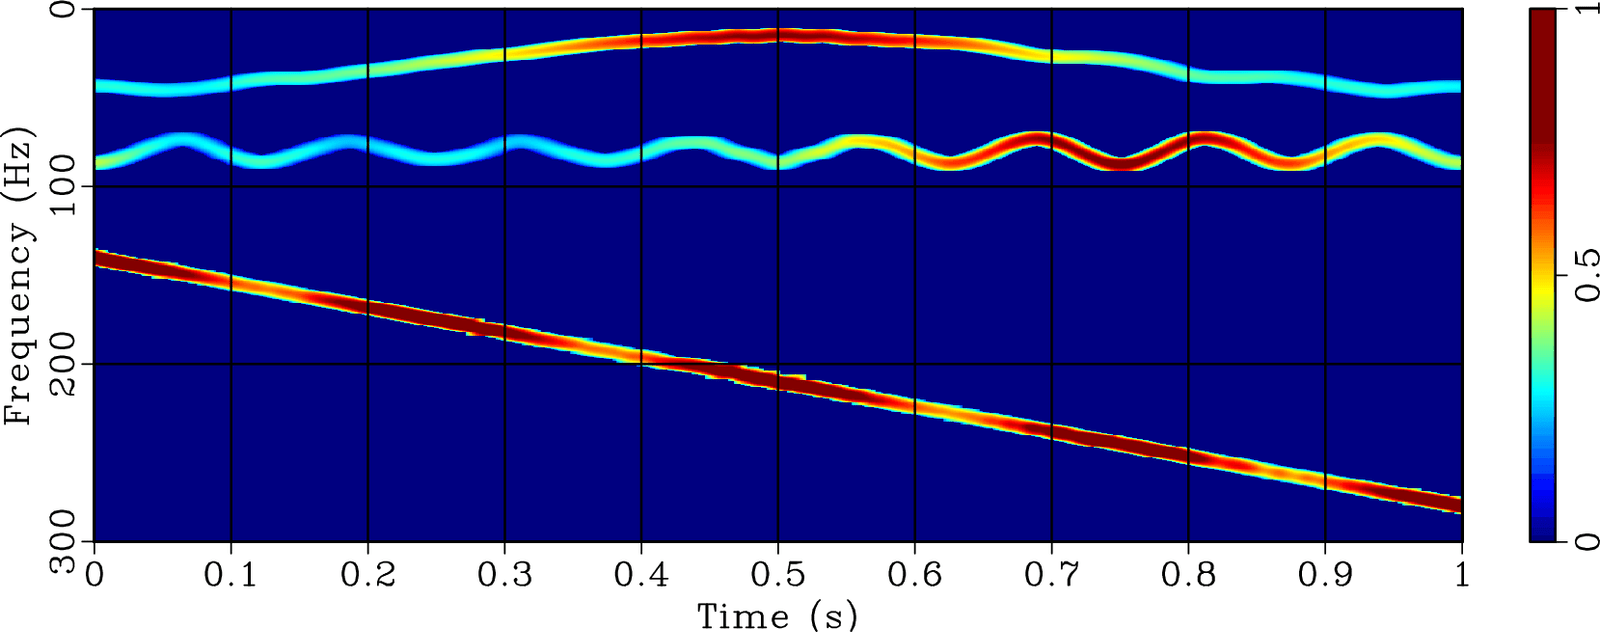
htf,htfemd,htfnar
Figure 5. (a) Time-frequency map for synthetic signal of Figure 1 using local attribute. (b) Time-frequency map for synthetic signal of Figure 1 using ensemble empirical mode decomposition. (c) Time-frequency map for synthetic signal of Figure 1 using the proposed method. |
|
|

|
|---|
|
msig
Figure 6. Synthetic signal. |
|
|

|
|---|
|
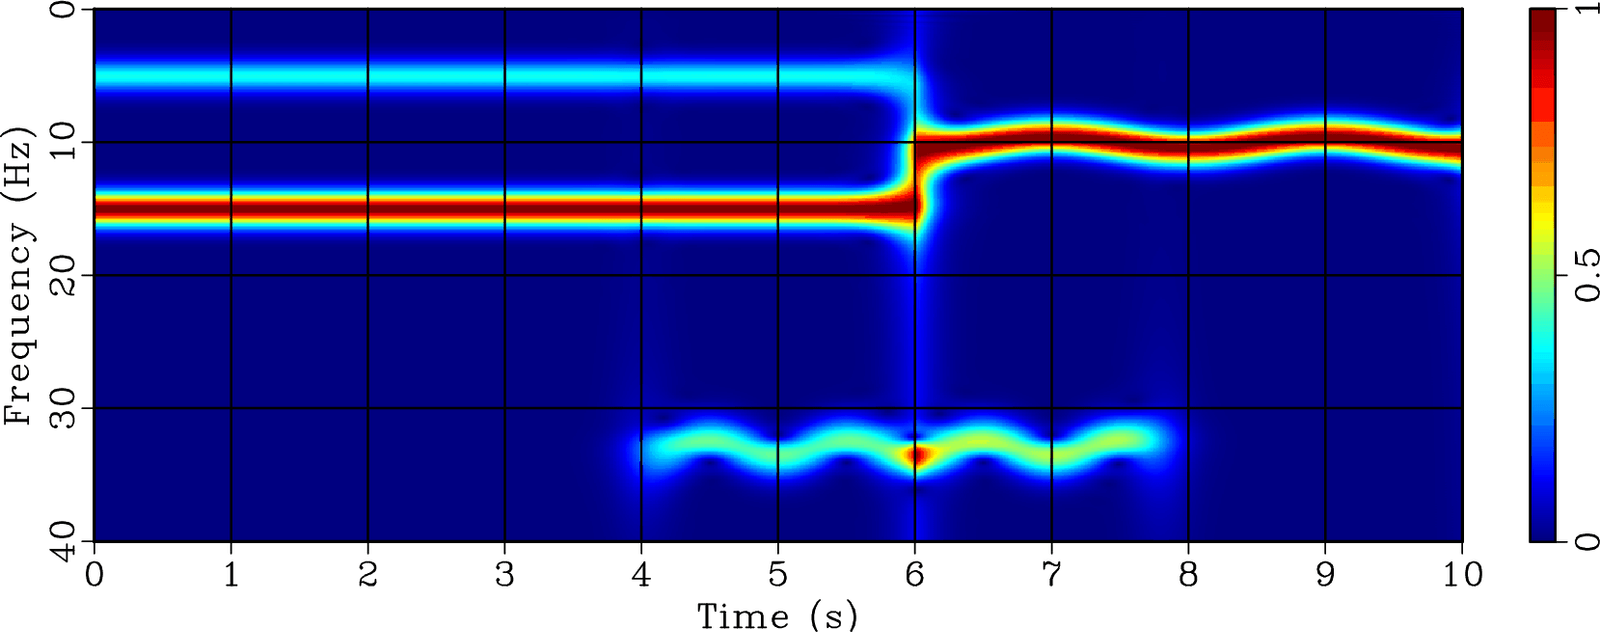
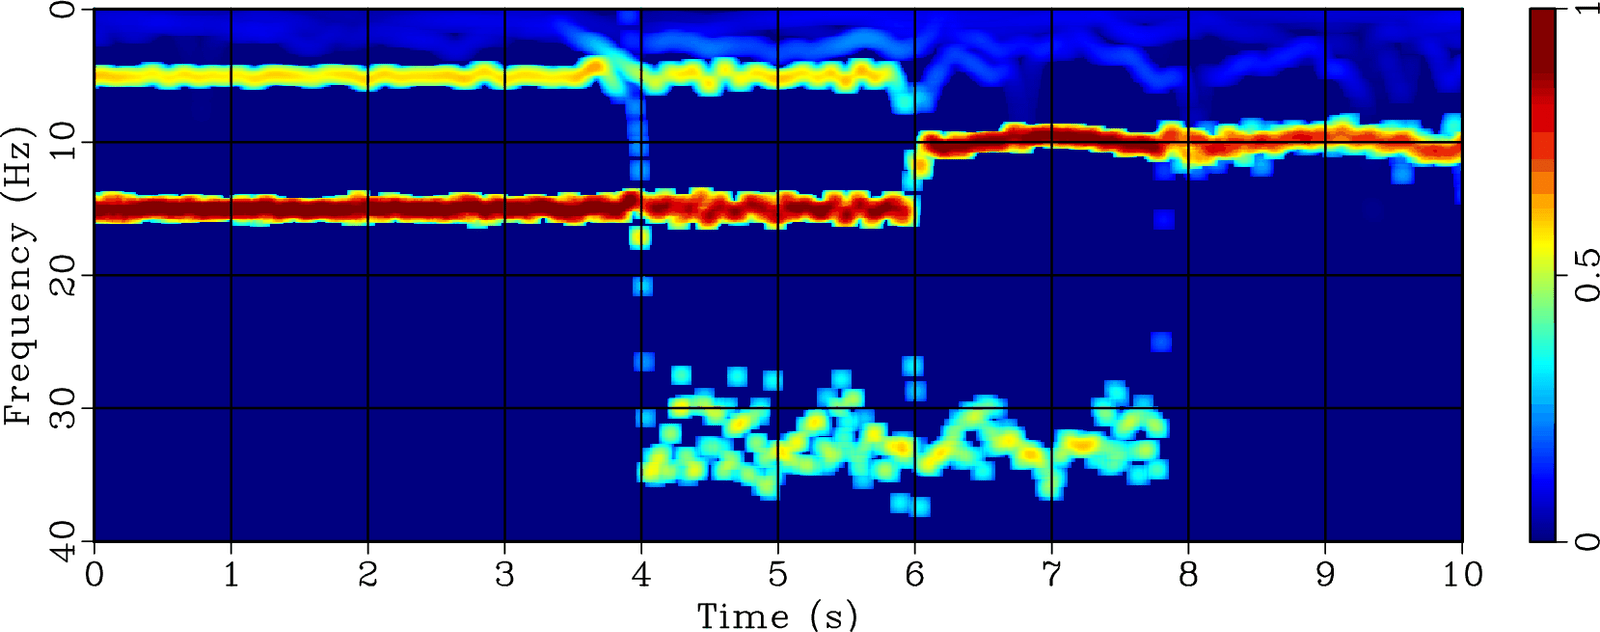
mtf,mtfemd,mtfnar
Figure 7. (a) Time-frequency map for synthetic signal of Figure 6 using local attribute. (b) Time-frequency map for synthetic signal of Figure 6 using ensemble empirical mode decomposition. (c) Time-frequency map for synthetic signal of Figure 6 using the proposed method. |
|
|
|
|
|
|
Data-driven time-frequency analysis of seismic data using non-stationary Prony method |