|
|
|
|
On anelliptic approximations for qP velocities in TI and orthorhombic media |
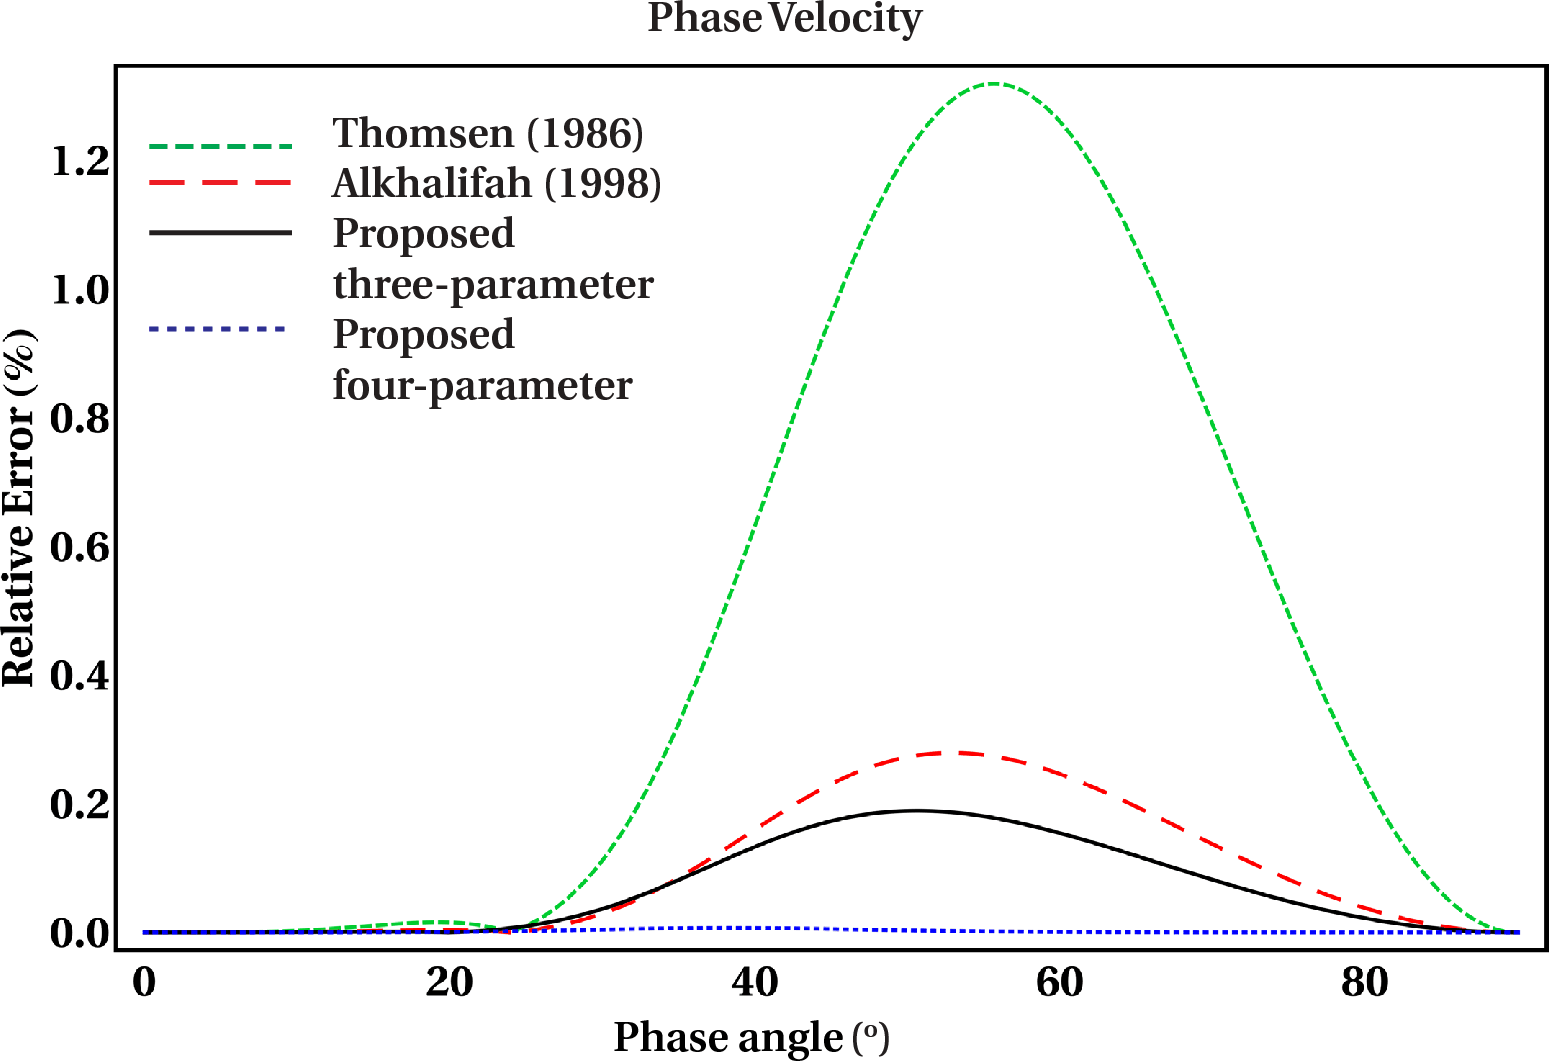
To investigate the accuracy of the proposed approximations, we make the relative error comparison with both plots and tables using several anisotropy models based on values from laboratory rock samples. The plots in Figure 2 are generated using the stiffness tensor measurements of Greenhorn shales (Jones and Wang, 1981), which have been applied for various approximation comparisons in the past (e.g. Farra and Pšencík, 2013; Fomel, 2004; Stovas, 2010; Dellinger, 1991). Additionally, Tables 4 and 5 show the RMS relative error results of the new approximations, in comparison with results from some of the previously suggested approximations using the normalized stiffness tensor measurements given in Table 6. The RMS error computation is based on
RMS error |
(39) |
| Sample | Thomsen (1986) | Alkhalifah (1998) | Proposed | |
| 1 | 0.6789 | 0.1422 | 0.0978 | |
| 2 | 0.6482 | 0.2254 | 0.0503 | |
| 3 | 0.4564 | 0.1399 | 0.0273 | |
| 4 | 0.2978 | 0.0485 | 0.0506 | |
| 5 | 0.1244 | 0.0541 | 0.0201 | |
| 6 | 0.5710 | 0.1631 | 0.0149 |
| Sample | Alkhalifah and Tsvankin (1995) | Fomel (2004) | Farra and Pšencík (2013) | Proposed |
| 1 | 1.0149 | 0.1210 | 0.2530 | 0.0801 |
| 2 | 0.3306 | 0.2179 | 0.1351 | 0.0564 |
| 3 | 0.4602 | 0.1311 | 0.0977 | 0.0194 |
| 4 | 0.1369 | 0.0467 | 0.0983 | 0.0492 |
| 5 | 0.0188 | 0.0540 | 0.0194 | 0.0202 |
| 6 | 0.4258 | 0.1541 | 0.1412 | 0.0084 |
| Shales sample | ||||||||
| 1. Greenhorn | 14.47 | 9.57 | 4.51 | 2.28 | 3.094 | 1.510 | 0.256 | -0.0505 |
| 2. Hard (brine) | 20.89 | 13.89 | 3.048 | 5.655 | 3.727 | 2.378 | 0.252 | 0.0347 |
| 3. North Sea (brine) | 7.292 | 5.248 | 1.578 | 1.798 | 2.291 | 1.341 | 0.195 | -0.0139 |
| 4. Dog Creek | 5.098 | 3.5163 | 2.4832 | 0.6823 | 1.875 | 0.826 | 0.225 | 0.0998 |
| 5. Mesaverde | 17.653 | 14.055 | 1.3391 | 6.87 | 3.749 | 2.621 | 0.128 | 0.0781 |
| 6. North Sea (dry) | 22.051 | 14.90 | 5.336 | 4.928 | 3.860 | 2.220 | 0.240 | 0.0199 |


|
|---|
|
vtiphaseplotlegnew,vtigroupplotleg1new,vtigroupplotleg2new
Figure 2. Relative error plots using Greenhorn Shale measurements. a) Phase velocity. b) Group velocity. c) Group velocity (finer scale). |
|
|
|
|
|
|
On anelliptic approximations for qP velocities in TI and orthorhombic media |