|
|
|
|
Lowrank seismic wave extrapolation on a staggered grid |
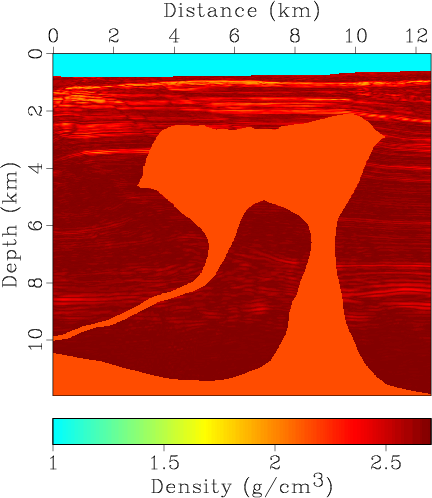
Finally we test the proposed methods in a complex velocity model. Figure 13 shows a part of the BP-2004 model, which is a complicated model containing a salt body and sharp velocity and density contrasts on the flanks of the salt body (Billette and Brandsberg-Dahl, 2004). We use a Ricker-wavelet at a point source with a dominant frequency of ![]()
![]() . Both of the horizontal grid size
. Both of the horizontal grid size ![]() and vertical grid size
and vertical grid size ![]() are
are ![]() , and the time step is
, and the time step is ![]() , thus,
, thus,
![]() and
and
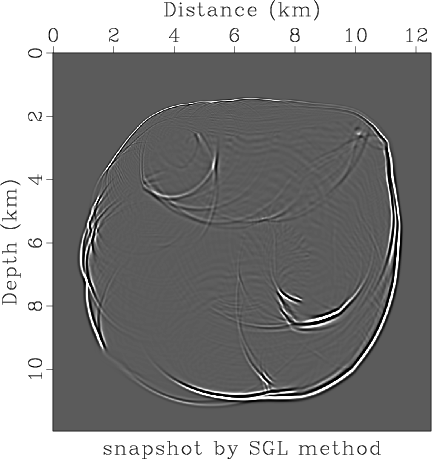
![]() . Figure 14 shows the wavefield snapshot in the BP model generated by SGL method and 6th order SGLFD with a rank of 3. This experiment confirms that the staggered grid lowrank methods are able to handle sharp velocity and density variations.
. Figure 14 shows the wavefield snapshot in the BP model generated by SGL method and 6th order SGLFD with a rank of 3. This experiment confirms that the staggered grid lowrank methods are able to handle sharp velocity and density variations.


|
|---|
|
vel,den
Figure 13. BP model: (a) velocity, (b) density. |
|
|


|
|---|
|
lrsnap,lfdsnap
Figure 14. Wavefield snapshot modeled through for BP Model using (a) SGL method and (b) SGLFD method. |
|
|
|
|
|
|
Lowrank seismic wave extrapolation on a staggered grid |