|
|
|
|
Processing the Teapot Dome Land 3D Survey with Madagascar |
cd ../geompaper
gedit SConstruct
The sffold command uses the trace header file created by sfsegyread to make a 3D histogram that shows the trace distribution in offset, xline, and iline. Sffold required the trace headers to be in floating point format and sfsegyread outputs the data in integer format, so sfdd is used to convert the headers to float. The program requires the header names and the first, number, and increment for offset, xline, and iline. The sfheaderattr run in the Fetchpaper directory provides the minimum and maximum of these headers. The increments (d1, d2, d3) are small enough to get good resolution on the plot, usually the group interval, xline interval, and iline interval. When you run:
scons
a fold plot or stacking diagram movie will be displayed on the screen. The movie shows the (offset,midpoint) trace distribution, one iline at a time. The first thing you will notice is some (xline,iline) locations do not have traces. 3D surveys are not usually perfect rectangles. They are collected over an exploration objective and there may be surface access restrictions. The standard approach in processing is to expand the data with zeros to a make a rectangular volume.
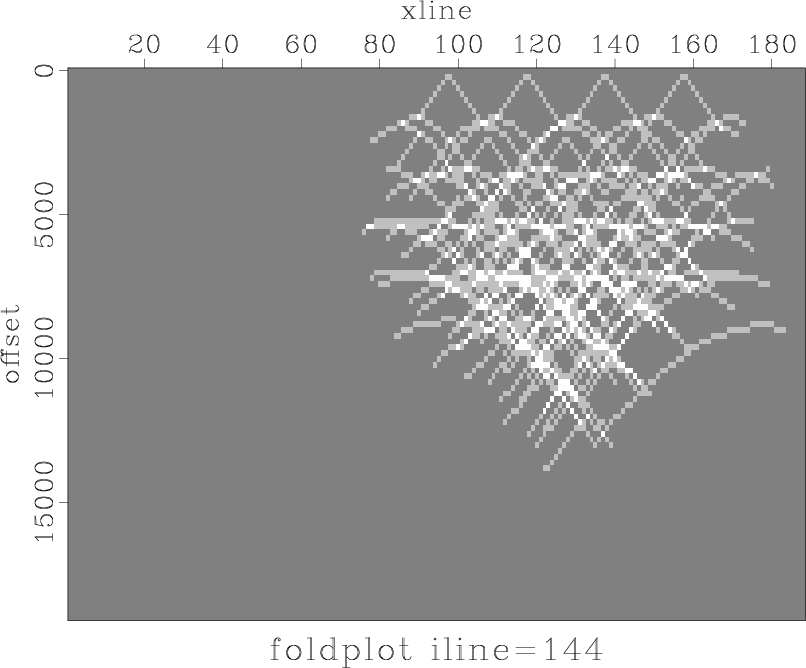
Stop the movie and position it to iline 144 and the plot should look like Figure 1. I selected iline 144 because it looks like this midpoint line very near to both a receiver line and a shot line. The relationship between the surface geometry and midpoint stacking plot is easier to observe. On this xline there are traces with almost zero offset and some traces form linear (xline,offset) patterns. These are traces from shots on the receiver line. The distance between zero offset traces is 20 xlines or 2200 ft (since xlines are 110 ft). 2200 feet is the shot line interval described in teapot_processing.pdf. There are also traces that form hyperbolic patterns in (xline,offset). The hyperbola apexes approximately line up with an offset interval of 1660 ft, twice the receiver line spacing.
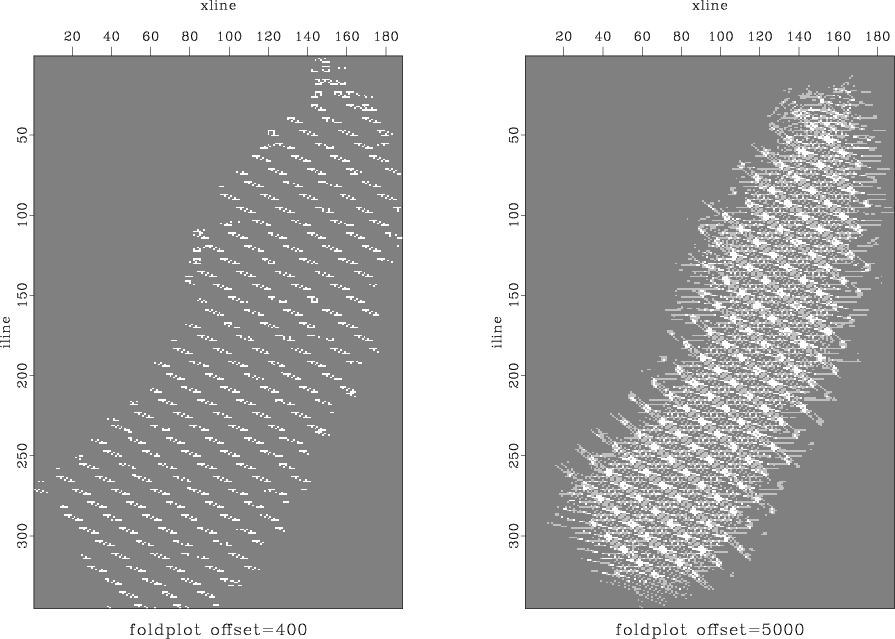
Type q in the movie window to quit from the iline foldplot movie and an offset fold plot movie will plot. If you stop the movie at offset 400 or 5000, it should look like Figure 2. These plots show the (xline,iline) trace distribution for offsets 200 +- 100 or 5000 +- 100 feet. This is called a 'fold map for a small offset subset'. The survey shape was designed to just cover the Teapot Dome anticline.
Run:
scons view
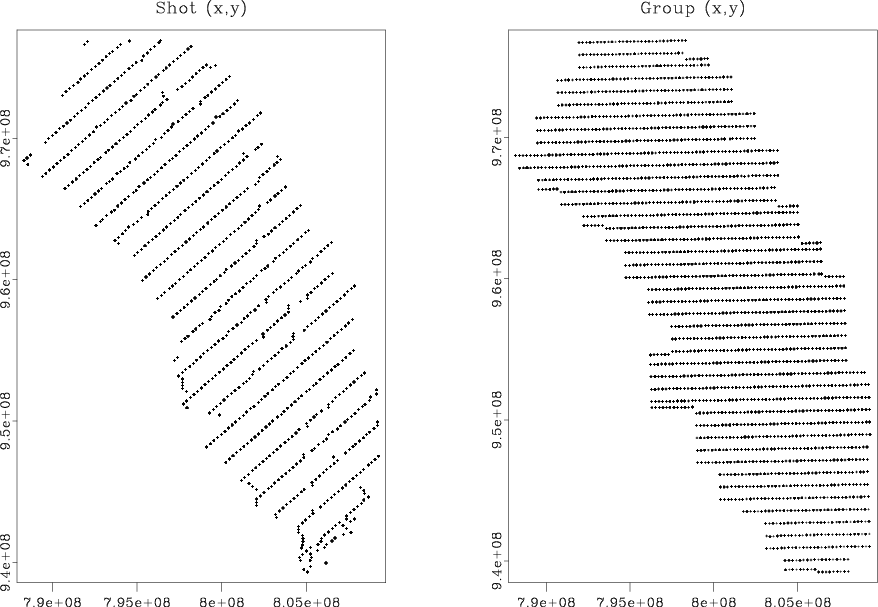
to recreate some foldplots and Figure 3, a map of the source and receiver coordinates will appear. A few observations can be made:
The take away from this section is that traces in a 3D land surveys have a complex distribution of source and receiver coordinates. There are books on the topic (eg 3D Seismic Survey Design, G. J. O. Vermeer)

|
|---|
|
foldplot144
Figure 1. Fold plot for iline 144 shows the trace (xline,offset) distribution. |
|
|

|
|---|
|
foldmap-400-5000
Figure 2. Fold plots for offsets 400 and 5000 meter shows the trace (xline,iline) distribution |
|
|

|
|---|
|
shots-receivers
Figure 3. source and receiver coordinate plots. |
|
|
|
|
|
|
Processing the Teapot Dome Land 3D Survey with Madagascar |