A Madagascar school will take place on January 7-8, 2015, in Harbin, China, and will be hosted by the Harbin Institute of Technology (HIT) in conjunction with the International Workshop on Mathematical Geophysics.

More information will be available soon on the school webpage.
Madagascar school in Harbin
November 13, 2014 Celebration No comments
Program of the month: sfthreshold
November 12, 2014 Programs No comments
sfthreshold filters the input by soft thresholding (shrinkage).
Soft thresholding is a point-by-point operation, which can be described mathematically as
$T_{\mu}[u] = \left\{\begin{array}{rcl} u – \mu\,\mbox{sign}(u) & \quad & \mbox{if}\,|u| > \mu \\ 0 & \quad & \mbox{if}\,|u| \le \mu\end{array}\right.$
Soft thresholding was analyzed by Donoho (1995) and became particularly popular thanks to the iterative shrinkage-thresholding algorithm by Daubechies et al. (2004).
Donoho, D. L. (1995). De-noising by soft-thresholding. Information Theory, IEEE Transactions on, 41(3), 613-627.
Daubechies, I., Defrise, M., & De Mol, C. (2004). An iterative thresholding algorithm for linear inverse problems with a sparsity constraint. Communications on pure and applied mathematics, 57(11), 1413-1457.
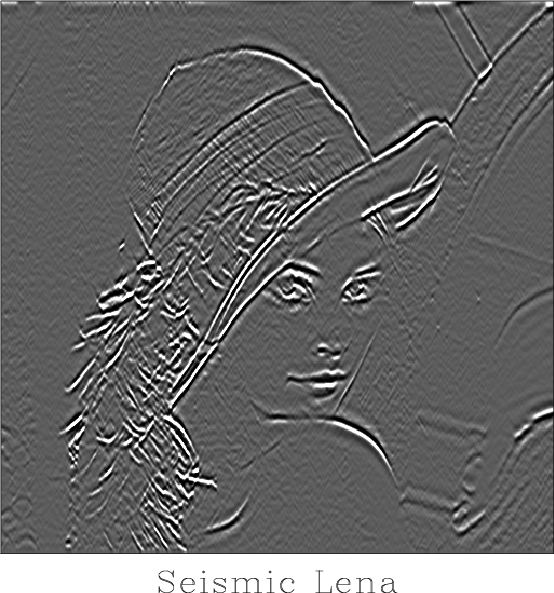
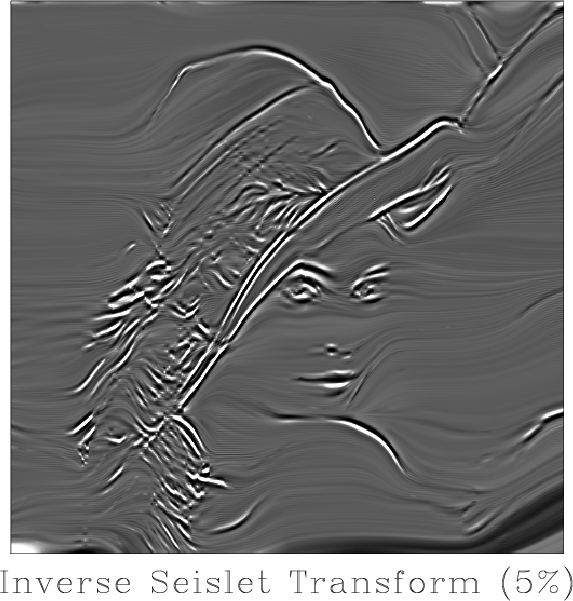
The following example from tccs/seislet/lena shows an image (Seismic Lena) and its reconstruction after soft thresholding in the seislet domain using 5% thresholding (pclip=5).
sfthreshold uses percentage parameter pclip= to set thresholding at the corresponding quantile of the data values. To do soft or hard thresholding with a fixed threshold, use sfthr.
An alternative thresholding-like operation is provided by sfsharpen.
10 previous programs of the month:
Seismic data analysis using SSWT
November 12, 2014 Uncategorized No comments
A new paper is added to the collection of reproducible documents:
Time-frequency analysis of seismic data using synchrosqueezing wavelet transform

Time-frequency (TF) decomposition is used for characterizing the non-stationary relation between time and instantaneous frequency, which is very important in the processing and interpretation of seismic data. The conventional time-frequency analysis approaches suffer from the contradiction between time resolution and frequency resolution. A new time-frequency analysis approach is proposed based on the synchrosqueezing wavelet transform (SSWT). The SSWT is an empirical-mode-decomposition-like tool but uses a different approach in constructing the components. With the help of the synchrosqueezing techniques, the SSWT can obtain obvious higher time and frequency resolution. Synthetic examples show that the SSWT based TF analysis can exactly capture the variable frequency components. Field data tests show the potential of the proposed approach in detecting anomalies of high-frequency attenuation and detecting the deep-layer weak signal.
Deblending using NMO median filtering
November 10, 2014 Documentation No comments
A new paper is added to the collection of reproducible documents:
Deblending using normal moveout and median filtering in common-midpoint gathers


The benefits of simultaneous source acquisition are compromised by the challenges of dealing with intense blending noise. In this paper, we propose a processing workflow for blended data. The incoherent property of blending noise in the common-midpoint (CMP) gathers is utilized for applying median filtering along the spatial direction after normal moveout (NMO) correction. The key step in the proposed workflow is that we need to obtain a precise velocity estimation which is required by the subsequent NMO correction. Because of the intense blending noise, the velocity scan can not be obtained in one step. We can recursively polish both deblended result and velocity estimation by deblending using the updated velocity estimation and velocity scanning using the updated deblended result. We use synthetic and field data examples to demonstrate the performance of the proposed approach. The migrated image of deblended data is cleaner than that of blended data, and is similar to that of unblended data.
Journals unite for reproducibility
November 10, 2014 Links No comments
 Simultaneous editorials in Science and Nature state
Reproducibility, rigour, transparency and independent verification are cornerstones of the scientific method. Of course, just because a result is reproducible does not make it right, and just because it is not reproducible does not make it wrong. A transparent and rigorous approach, however, will almost always shine a light on issues of reproducibility. This light ensures that science moves forward, through independent verifications as well as the course corrections that come from refutations and the objective examination of the resulting data.
The editorials describe Proposed Principles and Guidelines for Reporting Preclinical Research developed this summer and endorsed by dozens of leading scientific journals publishing in the field of biomedical research. The guidelines focus on the issue of reproducibility of scientific experiments and include provisions for sharing data and software.
Nature explains its software sharing policy further in the following statement:
Nature and the Nature journals have decided that, given the diversity of practices in the disciplines we cover, we cannot insist on sharing computer code in all cases. But we can go further than we have in the past, by at least indicating when code is available. Accordingly, our policy now mandates that when code is central to reaching a papers conclusions, we require a statement describing whether that code is available and setting out any restrictions on accessibility. Editors will insist on availability where they consider it appropriate: any practical issues preventing code sharing will be evaluated by the editors, who reserve the right to decline a paper if important code is unavailable.
These changes in publication policies by the leading scientific journals may lead to a fundamental change in scientific standards for reproducibility of computational experiments in different fields.
See also:
Robust time-to-depth conversion
November 9, 2014 Documentation No comments
A new paper is added to the collection of reproducible documents:
A robust approach to time-to-depth conversion and interval velocity estimation from time migration in the presence of lateral velocity variations
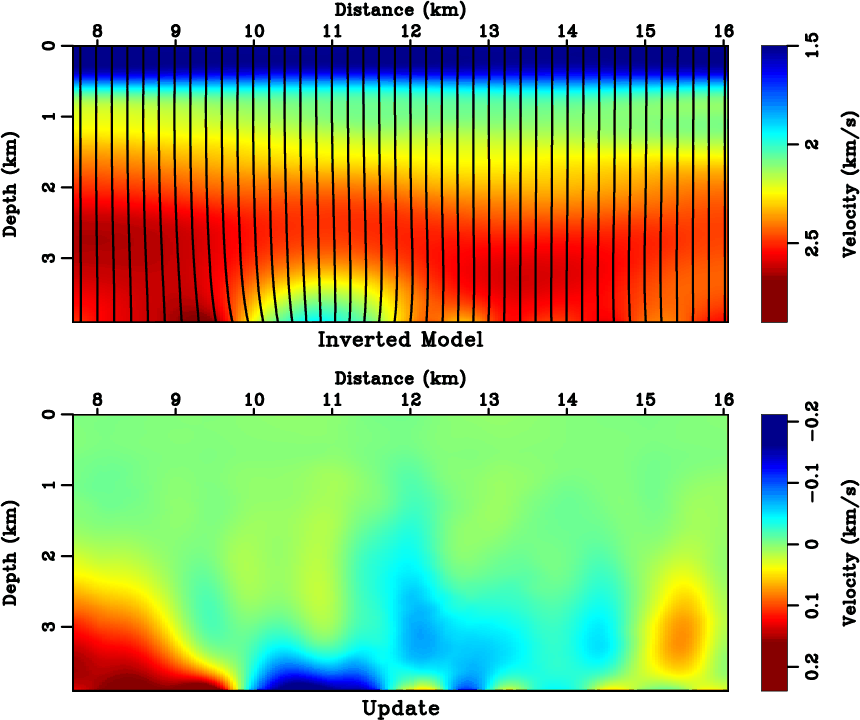
The problem of conversion from time-migration velocity to an interval velocity in depth in the presence of lateral velocity variations can be reduced to solving a system of partial differential equations. In this paper, we formulate the problem as a nonlinear least-squares optimization for seismic interval velocity and seek its solution iteratively. The input for inversion is the Dix velocity which also serves as an initial guess. The inversion gradually updates the interval velocity in order to account for lateral velocity variations that are neglected in the Dix inversion. The algorithm has a moderate cost thanks to regularization that speeds up convergence while ensuring a smooth output. The proposed method should be numerically robust compared to the previous approaches, which amount to extrapolation in depth monotonically. For a successful time-to-depth conversion, image-ray caustics should be either nonexistent or excluded from the computational domain. The resulting velocity can be used in subsequent depth-imaging model building. Both synthetic and field data examples demonstrate the applicability of the proposed approach.
Tutorial on parameter testing
October 22, 2014 Examples No comments
The example in rsf/tutorials/parameters reproduces the tutorial from Matt Hall on parameter testing. 
 Madagascar users are encouraged to try improving the results.
In his blog post and in the discussion that follows, Matt brings up an interesting question about finding the best way for parameter selection.
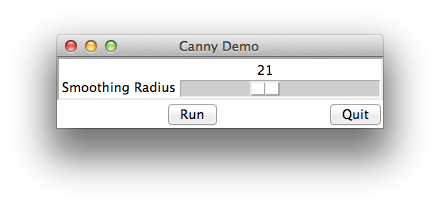
For the lack of a better approach, parameter selection in seismic attributes is just an interactive game. In the Madagascar version, the key parameter for the Canny edge detector is the amount of prior anisotropic-diffusion smoothing, controlled by the smoothing radius (rect= parameter.) We can do different things with it: for example, make a movie of different images looping through different values of the radius, or, by exposing the parameter to the command-line SCons interface, build a simple GUI script for controlling it. The question posted by Matt waits for a better answer.
See also:
Tutorial on colormaps
October 18, 2014 Examples No comments
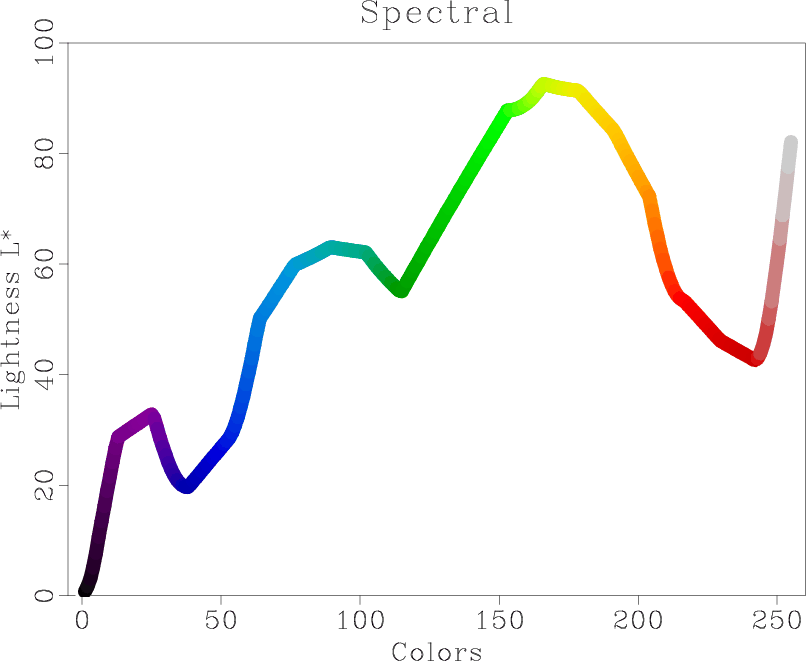
The example in rsf/tutorials/colormaps reproduces the tutorial from Matteo Niccoli on how to evaluate and compare color maps. The tutorial was published in the August 2014 issue of The Leading Edge. 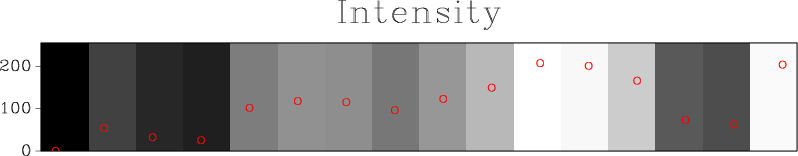
 Madagascar users are encouraged to try improving the results.
See also:
- Light Bartlein color palette
- Cube-helix color palette
- User-defined color palettes
- Standard color palettes
Several new color palettes have been recently added to Madagascar (thanks to Aaron Stanton): color=seismic (red-yellow-white-black, popular among seismic interpreters), color=owb (orange-white-black), and color=rwb (red-white-black).
Petition to raise awareness about the role of software in research
October 17, 2014 Links No comments

The Software Sustainability Institute in the UK has created an online petition to “everyone in the research community”, which states “We must accept that software is fundamental to research, or we will lose our ability to make groundbreaking discoveries.”
1. We want software to be treated as a valuable research object which befits the same level of investment and effort as any other aspect of the research infrastructure.
2. We want researchers to be encouraged to spend time learning about software, because the value of that knowledge is understood to improve research.
3. We want the people who develop research software to be recognised and rewarded for their invaluable contribution to research.
4. We want a research environment in which software-reliant projects are encouraged to hire software developers, rather than having to hide these valuable staff members in anonymous postdoctoral positions.
5. Ultimately, we want the research community to recognise softwares fundamental role in research.
You can sign the petition at Change.org.
Program of the month: sfsigmoid
October 8, 2014 Programs No comments
sfsigmoid generates a 2-D synthetic reflectivity model, created by Jon Claerbout.

One of the first occurrences of this model is in SEP-73 sponsor report from 1992, where it appeared in several papers:
- J. F. Claerbout, 1992, Introduction to Kirchhoff Migration Programs: SEP-73 report, 361-366, Stanford Exploration Project.
- J. F. Claerbout, 1992, Filling Data Gaps Using a Local Plane-Wave Model: SEP-73 report, 401-408, Stanford Exploration Project.
- J. F. Claerbout, 1992, Information from Smiles: Mono-Plane-Annihilator Weighted Regression: SEP-73 report, 409-420, Stanford Exploration Project.
-
J. F. Claerbout, 1992, Crossline Regridding by Inversion: SEP-73 report, 421-428, Stanford Exploration Project.
The model was described as “a synthetic model that illustrates local variation in bedding. Notice dipping bedding, curved bedding, unconformity between them, and a fault in the curved bedding.” Later, the sigmoid model made an appearance in Claerbout’s book Basic Earth Imaging. The following example from bei/krch/sep73 illustrates the effect of aliasing on Kirchhoff modeling and migration:

The model has appeared in numerous other tests. The following example from tccs/flat/flat shows automatic flattening of the sigmoid model by predictive painting.

sfsigmoid has several parameters that control the model. The usual n1=, n2=, o1=, o2=, d1=, d2= parameters control the mesh size and sampling, taper= indicates whether to taper the sides of the model, large= controls the length of the synthetic reflectivity series. The program takes no input.