next up previous [pdf]

Next: Numerically blended field data Up: Examples Previous: Numerically blended synthetic data

Numerically blended synthetic data - complex gather

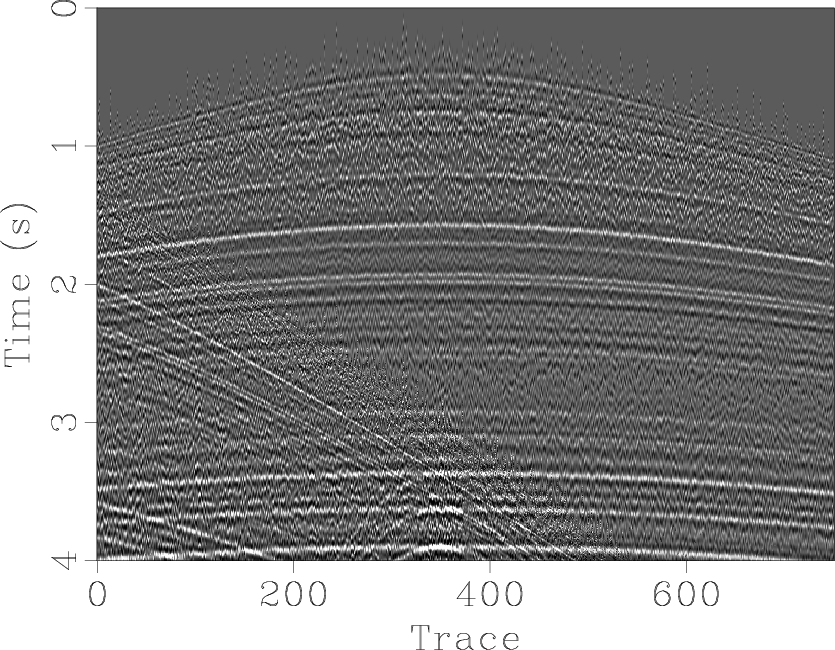
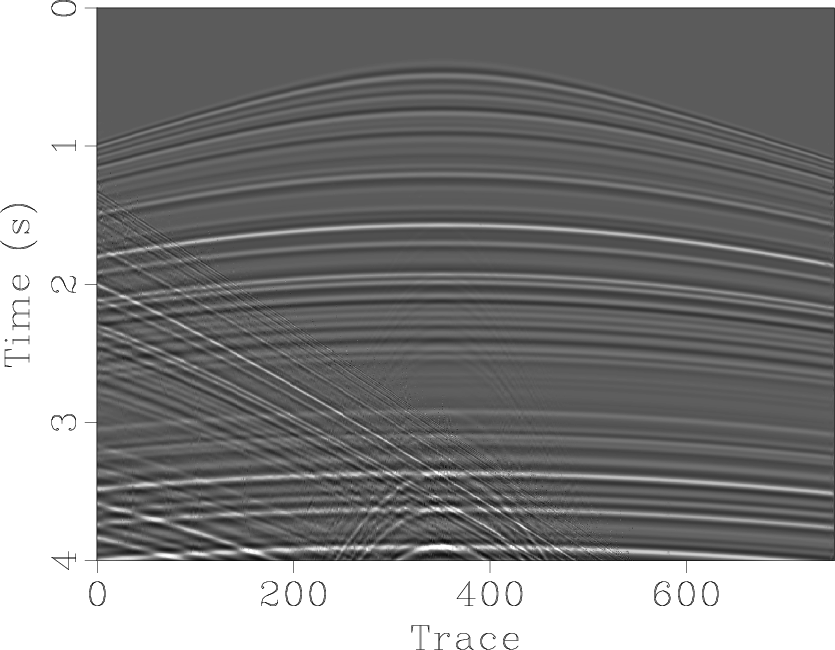
The third synthetic dataset consists of two complex gathers, which contain both useful seismic reflections and additional components such as ground roll and coherent dipping events. We simulate this example in order to best match the field data. The unblended and blended data are shown in Figures 9a and 9b, respectively. Figure 10 shows the deblending results for this case. Figure 11 shows the diagrams of changing SNR for both sources. The SNR for the converged deblended data becomes noticeably smaller compared with the previous examples for three different shaping operators respectively, which results from the fact that the seismic gather is no longer ideally sparse as the previous examples. Notice that in the noise sections for $ f-k$ domain thresholding (Figure 10a) and the noise sections for $ f-x$ predictive filtering (Figure 10c), there exist a certain amount of coherent events. However, for the seislet-domain soft thresholding, there are barely any coherent events. If we look carefully at the error sections corresponding to these three shaping operators, we can find that for the $ f-k$ domain thresholding, the estimation error comes from the useful hyperbolic reflections, the coherent dipping events, and the ground roll, for the $ f-x$ predictive filtering, the estimation error mainly comes from the useful hyperbolic reflections and the coherent dipping events, but for the seislet-domain soft thresholding, only a small amount of the ground roll and negligible amount of coherent dipping events and deep-water horizontal reflections are left on the error sections, which is not important for the whole processing tasks. We can conclude that for complex datasets like this synthetic example, seislet-domain soft thresholding is the preferable approach for shaping regularization. In this case, the percentages we use for $ f-k$ domain and seislet domain thresholding are both 20 %, the filter length we use for $ f-x$ predictive filtering is 4 samples.

complex1 complexs
complex1,complexs
Figure 9.
Numerically blended synthetic data (complex gather). (a) Unblended data. (b) Blended data.
[pdf] [pdf] [png] [png] [scons]

complexdeblendedfft1 complexdeblendedslet1 complexdeblendedfxdecon1 complexdifffft1 complexdiffslet1 complexdifffxdecon1 complexerrorfft1 complexerrorslet1 complexerrorfxdecon1
complexdeblendedfft1,complexdeblendedslet1,complexdeblendedfxdecon1,complexdifffft1,complexdiffslet1,complexdifffxdecon1,complexerrorfft1,complexerrorslet1,complexerrorfxdecon1
Figure 10.
Deblending comparison for numerically blended synthetic data (complex gather). (a) Deblended result using $ f-k$ domain thresholding. (b) Deblended result using seislet-domain thresholding. (c) Deblended result using $ f-x$ predictive filtering. (d) Blending noise corresponding to (a). (e) Blending noise corresponding to (b). (f) Blending noise corresponding to (c). (g) Estimation error corresponding to (a). (h) Estimation error corresponding to (b). (i) Estimation error corresponding to (c).
[pdf] [pdf] [pdf] [pdf] [pdf] [pdf] [pdf] [pdf] [pdf] [png] [png] [png] [png] [png] [png] [png] [png] [png] [scons]

complexsnrsa
complexsnrsa
Figure 11.
Diagrams of SNR for synthetic example (complex gather). The "+" line corresponds to seislet-domain thresholding. The "o" line corresponds to $ f-k$ domain thresholding. The "*" line corresponds to $ f-x$ predictive filtering.
[pdf] [png] [scons]


next up previous [pdf]

Next: Numerically blended field data Up: Examples Previous: Numerically blended synthetic data

2014-08-20