|
|
|
|
Madagascar tutorial: Field data processing |

|
|---|
|
cmp,nmo,taup,nmo2
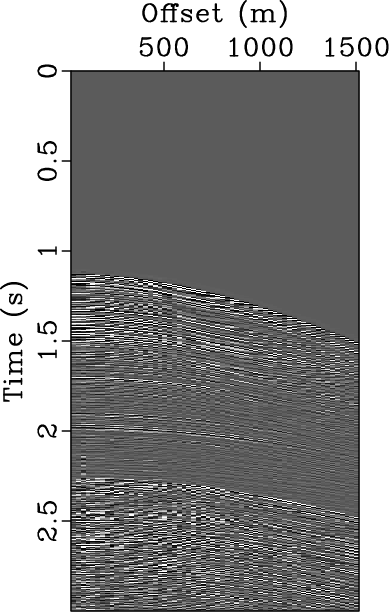
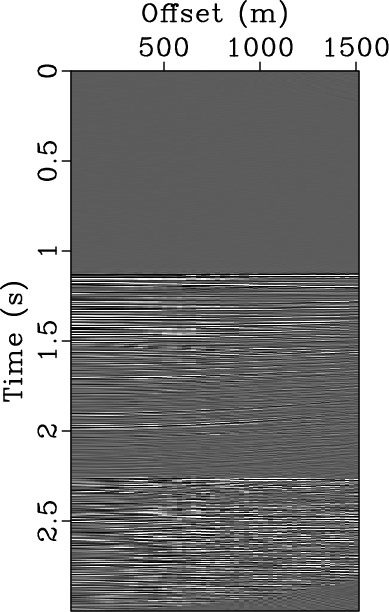
Figure 1. CMP gather from Canterbury dataset before applying NMO (a), after applying NMO (b), after Forward parabolic Radon transfrom (c), after applying inverse parabolic Radon transform (d). The forward and inverse parabolic Radon transforms are applied in sequence to examine the parameters of the process and to ensure that no events are lost during the process |
|
|
Figure 3(a) shows a CMP gather from Canterbury data set Line 12. The multiple energy appears at time around 2.25 s. Figure 1(b) shows the same gather after applying NMO correction with veloctiy equals to 1500 m/s. The multiple events starting at around 2.25 s and below are flatened while primary events , e.g at 2 s, are over corrected. The difference in move-out between the primaries and multiples, hence, can be used in Radon domain to attenuate multiple energy. Figure 2(a) is generated by forward parabolic Radon transform while Figure 1(d) is generated by inverse parabloic Radon transform. The purpose was to make sure that forward and inverse transforms do not cause any data loss.


|
|---|
|
taup,taupmult
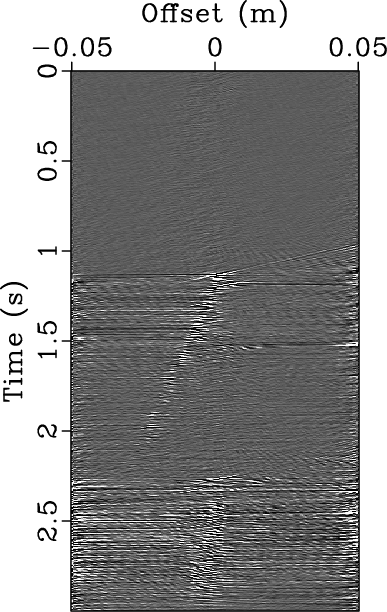
Figure 2. Forward Radon transform of the gather (a). Mute is applied to preserve multiples (b); so that multiples can be transformed to time-offset domain for subtraction from the CMP gather. |
|
|
Figure 2(a) shows the Radon transform of the CMP gather in Figure 3(a) while Figure 2(b) shows in the Radon domain the multiple energy only after mutting the primary energy. The protected multiples can be taken back to the time-offset domain and are subtracted from the data.


|
|---|
|
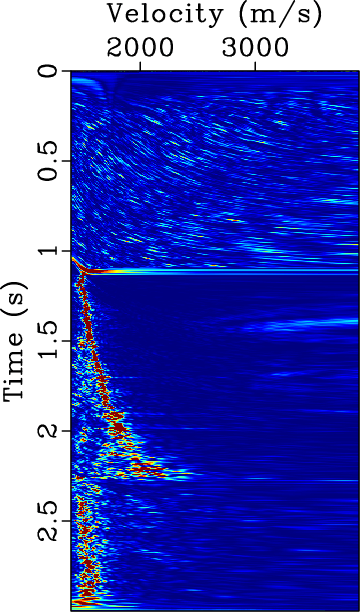
cmp,signal2,vscan-cmp,vscan-signal2
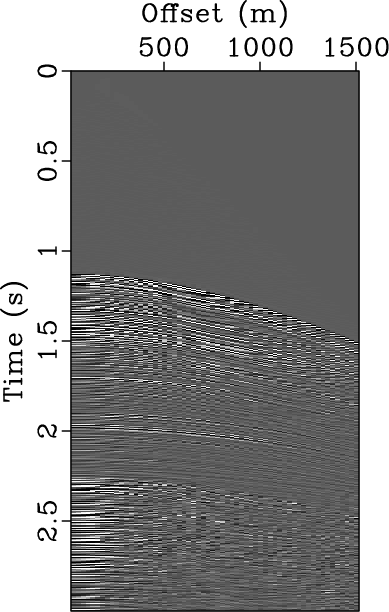
Figure 3. CMP gather before multiple attenuation (a). CMP gather after multiple attenuation (b). Gather in (a) is used to generated semblance scan in (c). Gather in (b) is used to generate semblance scan in (d). |
|
|
CMP gather before multiple attenuation is shown in Figure 3(a) and the coresponding semblance scan is shown in Figure 3(c). The CMP gather after multiple attenuation is shown in Figure 3(b) and the coresponding semblance scan is shown in Figure 3(d). The semblance scans show how multiple energy is reduced for the CMP gather after multiple attenuation.
bash$ scons taup-qc.view
bash$ sfradonCheck your result by running
scons taup-qc.view
scons taup-mult.view
scons taup-mult.view
scons signal2.vpl
Display the figure by running
sfpen signal2.vplHint: the SConstruct file has similar code for creating the figure
scons cmp-signal2.view
Hint: the SConstruct file has a similar example
scons vcmp-signal2.view
Hint: the SConstruct file has a similar example
|
|
|
|
Madagascar tutorial: Field data processing |