|
|
|
|
Homework 4 |
|
data
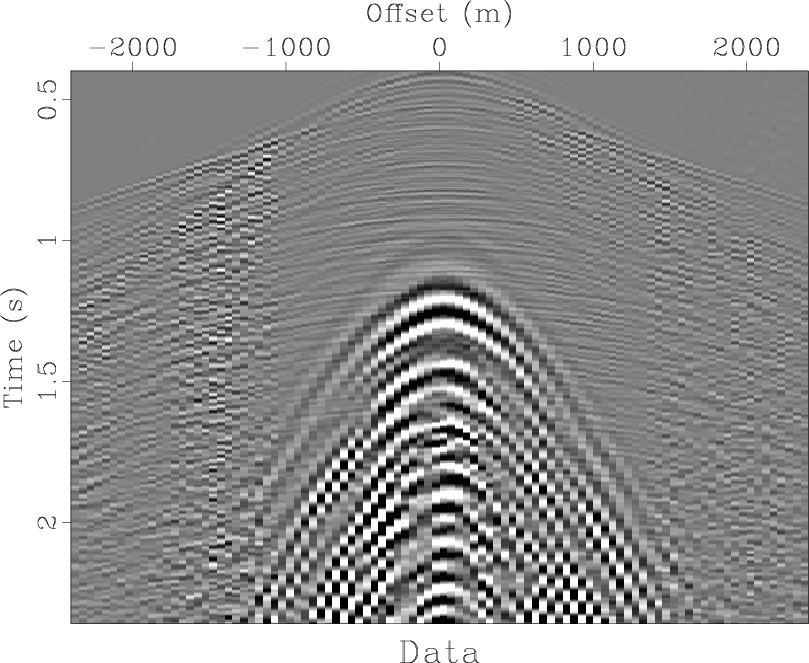
Figure 1. Seismic shot record from sand dunes in the Middle East. The data are contaminated by ground roll propagating in the sand. |
|
|---|---|
|
|
Figure 1 shows a section out of a seismic shot record collected over sand dunes in the Middle East. The data are contaminated by ground roll propagating in the sand. A major data analysis task is to separate the signal (reflection waves) from the noise (surface waves).

|
|---|
|
spec0
Figure 2. Data spectrum. Solid line - original data. Dashed line - initial noise model and signal model. |
|
|
A quick look at the data spectrum (Figure 2) shows that the noise is mostly concentrated at low frequencies. We can use this fact to create a noise model by low-pass filtering.

|
|---|
|
noise0
Figure 3. (a) Noise model created by low-pass filtering of the original data. (b) Result of subtraction of the noise model from the data. |
|
|
Figure 3 shows the noise model from low-pass filtering
and inner muting and the result of subtracting this model from the
data. Our next task is to match the model to the true noise by solving
the least-squares optimization problem
/* Match filtering */
#include <rsf.h>

int main(int argc, char* argv[])
{
    bool adj;
    int n1, n2, i1, i2, i, j, nf;
    float *data, *noiz, *filt;
    sf_file inp, out, oth;

    sf_init(argc,argv);
    inp = sf_input("in");
    out = sf_output("out");
    oth = sf_input("other");

    if (!sf_getbool("adj",&adj)) adj=false;
    /* adjoint flag */

    if (adj) {
	/* input data, output filter */
	if (!sf_histint(inp,"n1",&n1)) sf_error("No n1=");
	if (!sf_histint(inp,"n2",&n2)) sf_error("No n2=");
	if (!sf_getint("nf",&nf)) sf_error("Need nf=");
	/* filter size */

	sf_putint(out,"n1",nf);
	sf_putint(out,"n2",1);
    } else {
	/* input filter, output data */
	if (!sf_histint(inp,"n1",&nf)) sf_error("No n1=");
	if (!sf_histint(oth,"n1",&n1)) sf_error("No n1=");
	if (!sf_histint(oth,"n2",&n2)) sf_error("No n2=");

	sf_fileflush(out,oth);  /* copy data dimensions */
    }

    filt = sf_floatalloc(nf);
    data = sf_floatalloc(n1);
    noiz = sf_floatalloc(n1);

    if (adj) {
	for (i=0; i < nf; i++) /* !!! COMPLETE LINE !!! */
    } else {
	sf_floatread(filt,nf,inp);
    }

    for (i2=0; i2 < n2; i2++) {
	sf_floatread(noiz,n1,oth);

	if (adj) {
	    sf_floatread /* !!! COMPLETE LINE !!! */
	} else {
	    for (i1=0; i1 < n1; i1++) data[i1] = 0.;
	}

	for (i=0; i < nf; i++) {
	    for (i1=0; i1 < n1; i1++) {
		j=i1-i+nf/2; /* symmetric filter */

		/* zero value boundary conditions */
		if (j < 0 || j >= n1) continue;

		if (adj) {
		    filt[i] += /* !!! COMPLETE LINE !!! */
		} else {
		    data[i1] += noiz[j]*filt[i];
		}
	    }
	}

	if (!adj) sf_floatwrite(data,n1,out);
    }

    if (adj) sf_floatwrite  /* !!! COMPLETE LINE !!! */

    exit(0);
}
|
#!/usr/bin/env python

import sys
import numpy as np
import m8r

# initialize
par = m8r.Par()
inp = m8r.Input()
out = m8r.Output()
oth = m8r.Input('other')

adj = par.bool('adj',False) # adjoint flag

if adj:
    # input data, output filter
    n1 = inp.int('n1')
    n2 = inp.int('n2')
    nf = par.int('nf') # filter size

    out.put('n1',nf)
    out.put('n2',1)
else:
	# input filter, output data
    nf = inp.int('n1')
    n1 = oth.int('n1')
    n2 = oth.int('n2')

    out.put('n1',n1)
    out.put('n2',n2)

filt = np.zeros(nf,'f')
data = np.zeros(n1,'f')
noiz = np.zeros(n1,'f')

if not adj:
    inp.read(filt)

for i2 in range(n2):
    oth.read(noiz)

    if adj:
	    inp.read # !!! COMPLETE LINE !!
    else:
        data[:] = 0.

    for i in range(nf):
        for i1 in range(n1):
            j=i1-i+nf//2 # symmetric filter

            # zero value boundary conditions
            if j < 0 or j >= n1:
                continue

            if adj:
                filt[i] += # !!! COMPLETE LINE !!!
            else:
                data[i1] += noiz[j]*filt[i]

    if not adj:
        out.write(data)

if adj:
    out.write  # !!! COMPLETE LINE !!!

sys.exit(0)
|
Your task:
scons viewto reproduce the figures on your screen.
scons dot.testRepeating this several times, make sure that the numbers in the test match.
from rsf.proj import *

# Critical parameters
###########################
cut = 12 # cutoff frequency
nf  = 11 # filter length
###########################

# Download data
Fetch('dune3D.H','mideast')

# Plotting macro
def grey(title):
    return '''
    window n1=490 |
    grey clip=2.5 title="%s"
    label1=Time unit1=s label2=Offset unit2=m
    ''' % title

# Select one 2-D slice
Flow('data','dune3D.H',
     '''
     dd form=native |
     window n3=1 f3=2 n1=500 f1=100 |
     scale dscale=100
     ''')
Result('data',grey('Data'))

# Create noise model by low-pass filtering
Flow('noise0','data',
     '''
     bandpass fhi=%g |
     mutter half=n v0=1500 t0=0.8 hyper=y tp=0.12 |
     cut n1=90
     ''' % cut)
Plot('noise0',grey('Noise Model'))

# Signal = Data - Noise
Flow('signal0','data noise0','add scale=1,-1 ${SOURCES[1]}')
Plot('signal0',grey('Signal Model'))

Result('noise0','noise0 signal0','SideBySideIso')

# Plot spectrum
Plot('spec','data',
     '''
     spectra all=y |
     graph title="Average Spectrum" max2=3 label2=
     ''')
Plot('nspec0','noise0',
     '''
     spectra all=y |
     graph wanttitle=n wantaxis=n max2=3 plotcol=5 dash=1
     ''')
Plot('sspec0','signal0',
     '''
     spectra all=y |
     graph wanttitle=n wantaxis=n max2=3 plotcol=4 dash=2
     ''')
Result('spec0','spec nspec0 sspec0','Overlay')

# Matching filter program
# program = Program('match.c')

# COMMENT ABOVE AND UNCOMMENT BELOW IF YOU WANT TO USE PYTHON
program = Command('match.exe','match.py','cp $SOURCE $TARGET')
AddPostAction(program,Chmod(program,0o755))

match = program[0]

# Dot product test
Flow('filt0',None,'spike n1=%d' % nf)
Flow('dot.test','%s data noise0 filt0' % match,
     '''
     dottest ./${SOURCES[0]} nf=%d
     dat=${SOURCES[1]} other=${SOURCES[2]}
     mod=${SOURCES[3]}
     ''' % nf,stdin=0,stdout=-1)

# Conjugate-gradient optimization
Flow('filt','data %s noise0 filt0' % match,
     '''
     conjgrad ./${SOURCES[1]} nf=%d niter=%d
     other=${SOURCES[2]} mod=${SOURCES[3]}
     ''' % (nf,2*nf))

# Extract new noise and signal
Flow('noise','filt %s noise0' % match,
     './${SOURCES[1]} other=${SOURCES[2]}')
Flow('signal','data noise','add scale=1,-1 ${SOURCES[1]}')

End()
|
|
|
|
|
Homework 4 |