Systems

Madagascar in Google Colab

August 23, 2022 Systems No comments

Google Colaboratory is a popular service for running Jupyter notebooks in a cloud environment using the computational resources provided by Google.

As with other cloud services, it is possible to configure Google Colab to work with Madagascar. The solution is shown in this notebook.

Enhancements to Python interface

April 9, 2021 Systems No comments

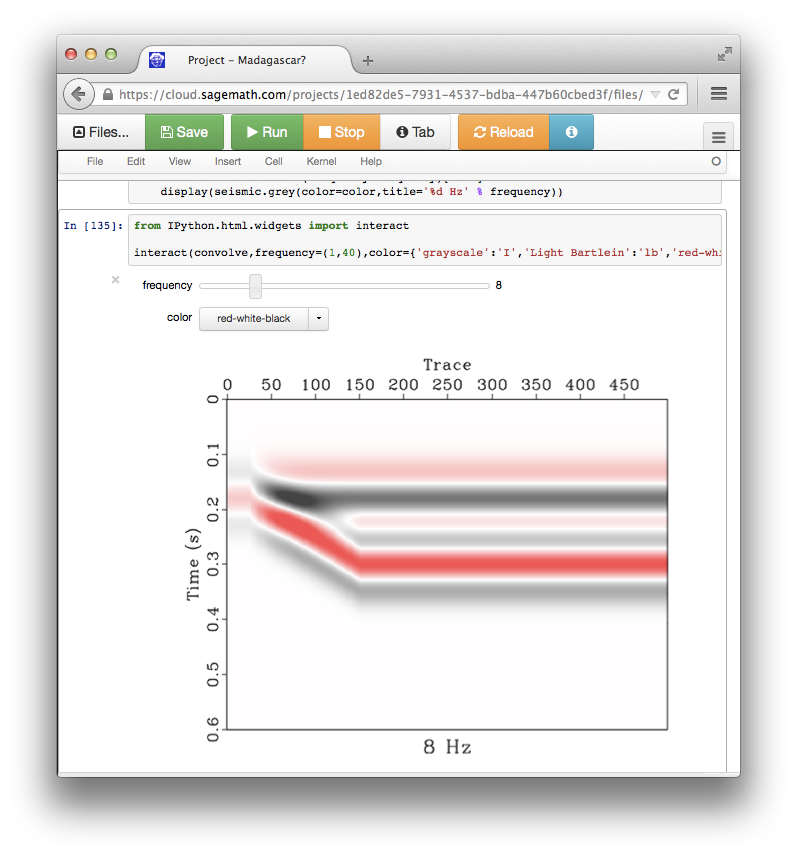
Several enhancements have been added to Madagascar’s Python interface.

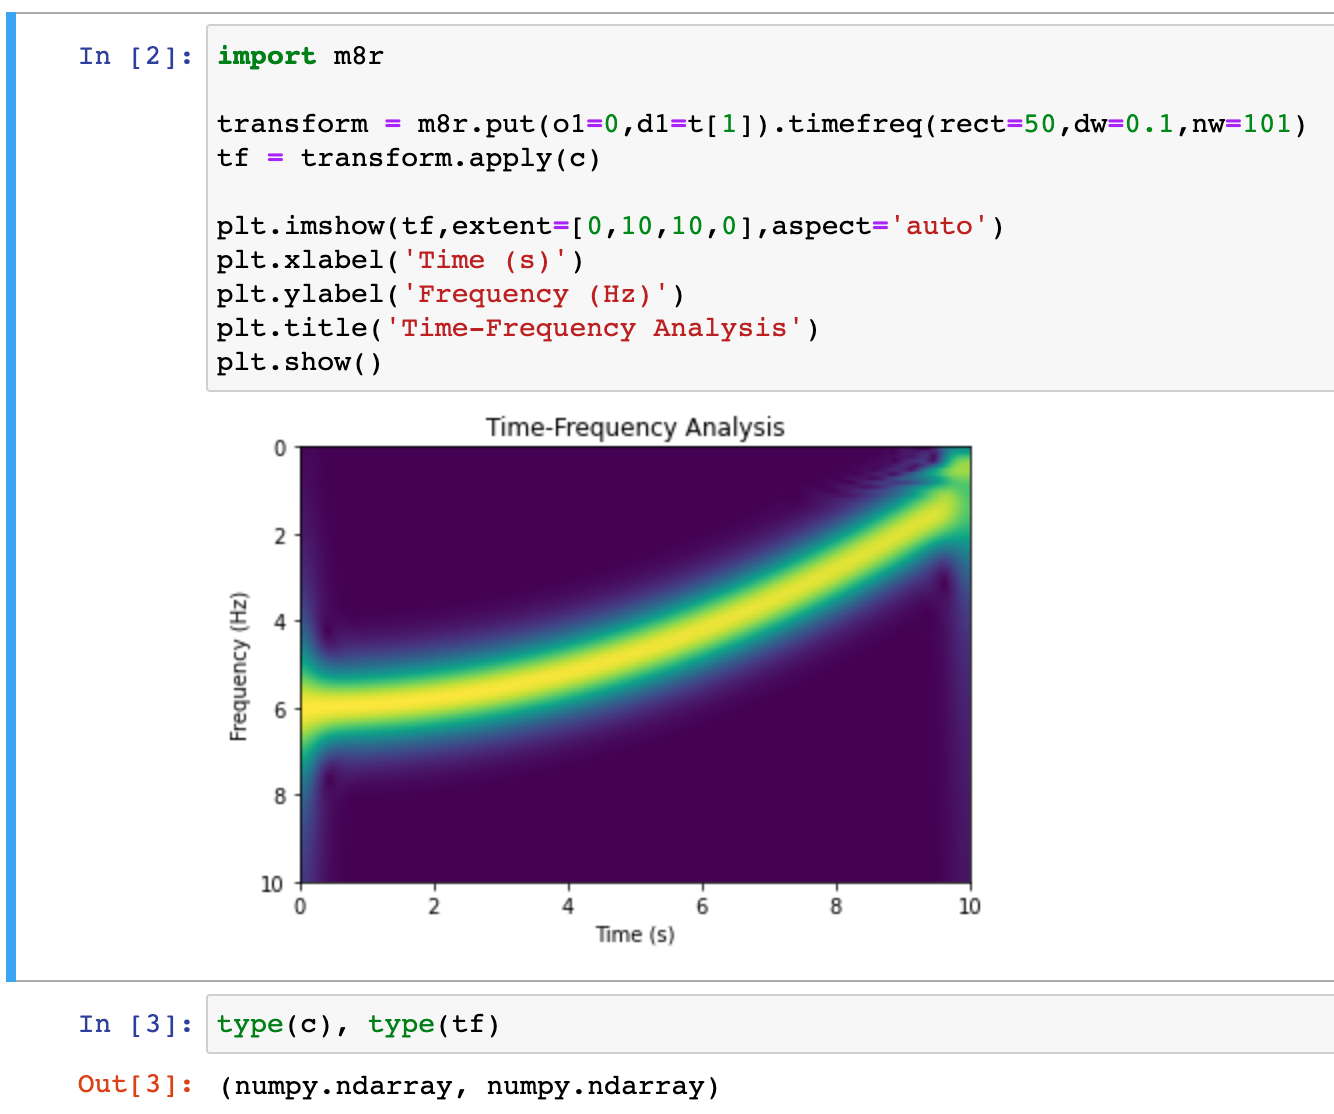
Behind the scene, temporary files are created, and Madgascar programs run in the usual way, but, for the user, they appears like native Python functions. This way, the full power of Madagascar becomes available to people who prefer to work on data analysis projects in a Python environment.

  • However, there is no good reason to abandon Madagascar’s use of SCons for managing data analysis workflows even when working in a Python framework. Because SConstruct scripts are written in Python, they are easy to adapt for including Python functions in place of command-line instructions. See an example of using Keras with SCons or an example of using PyTorch with SCons.

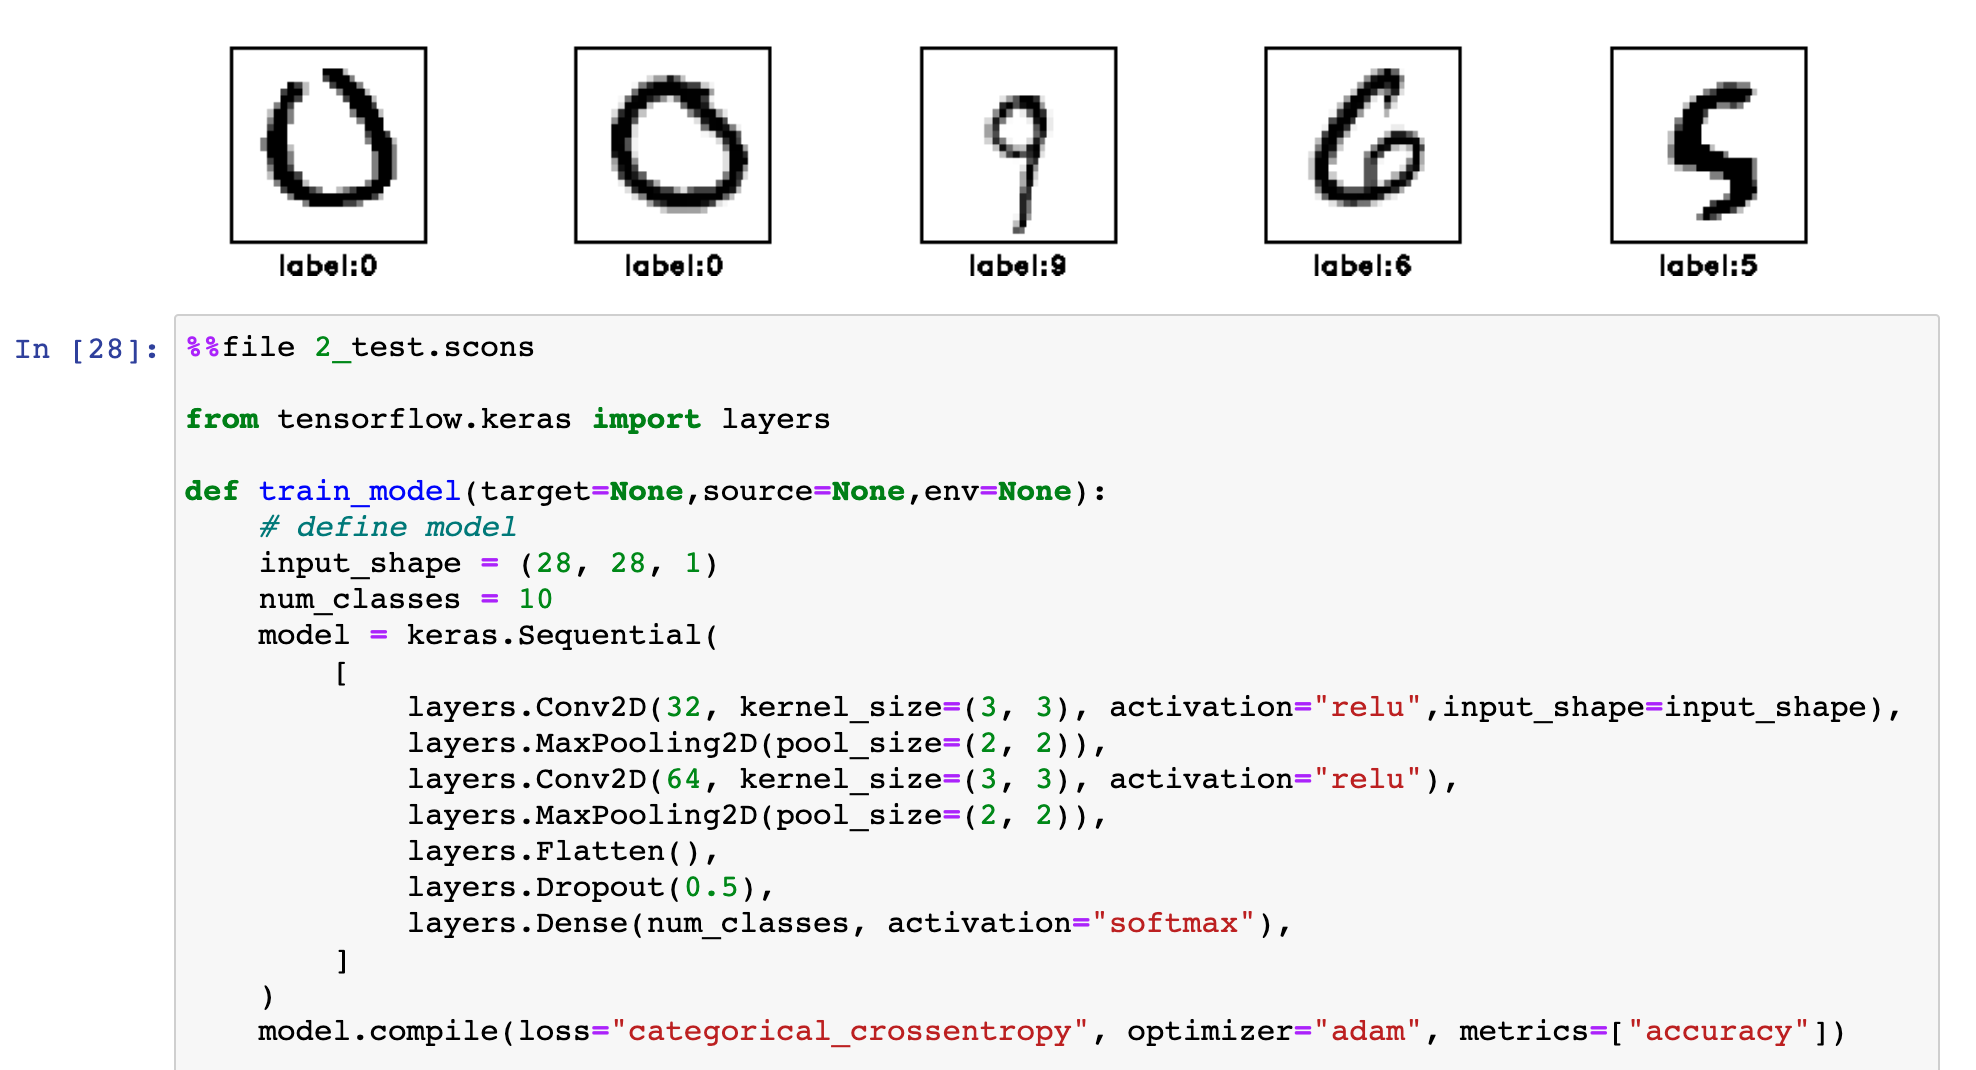
In deep learning projects, the training data, the neural-network model, and the testing data can be treated as files and handled effectively through SCons workflows while mixing with Madagascar commands and workflows.

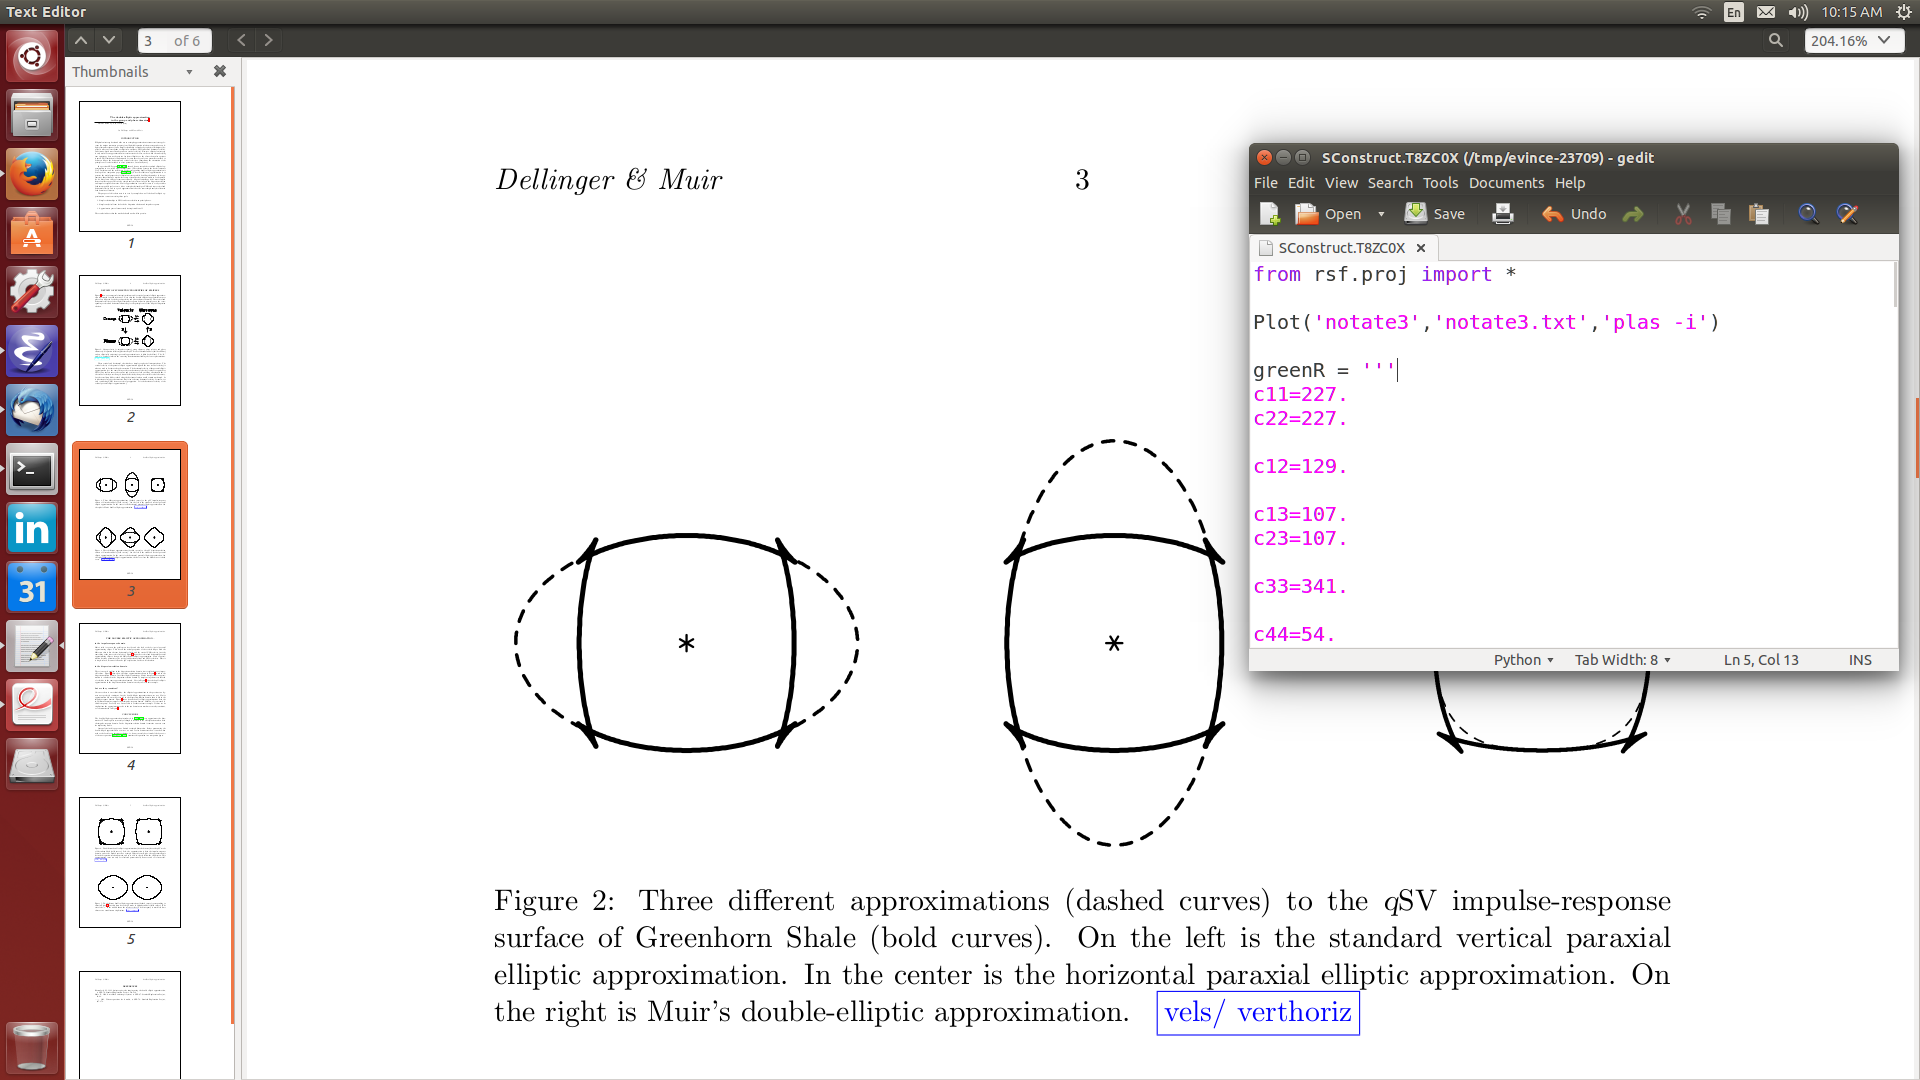
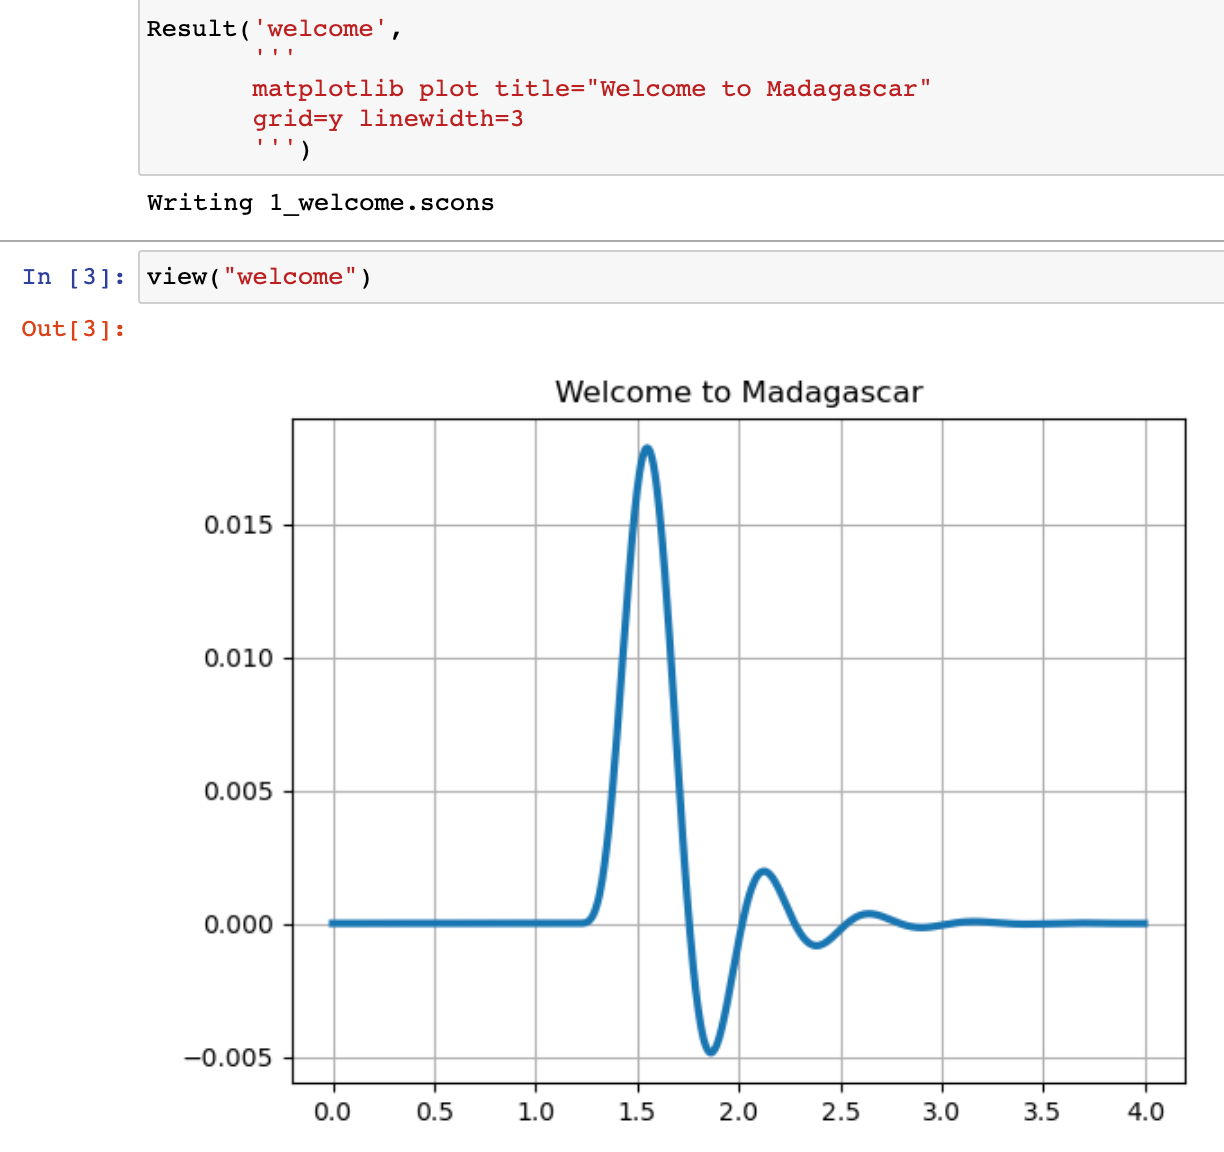
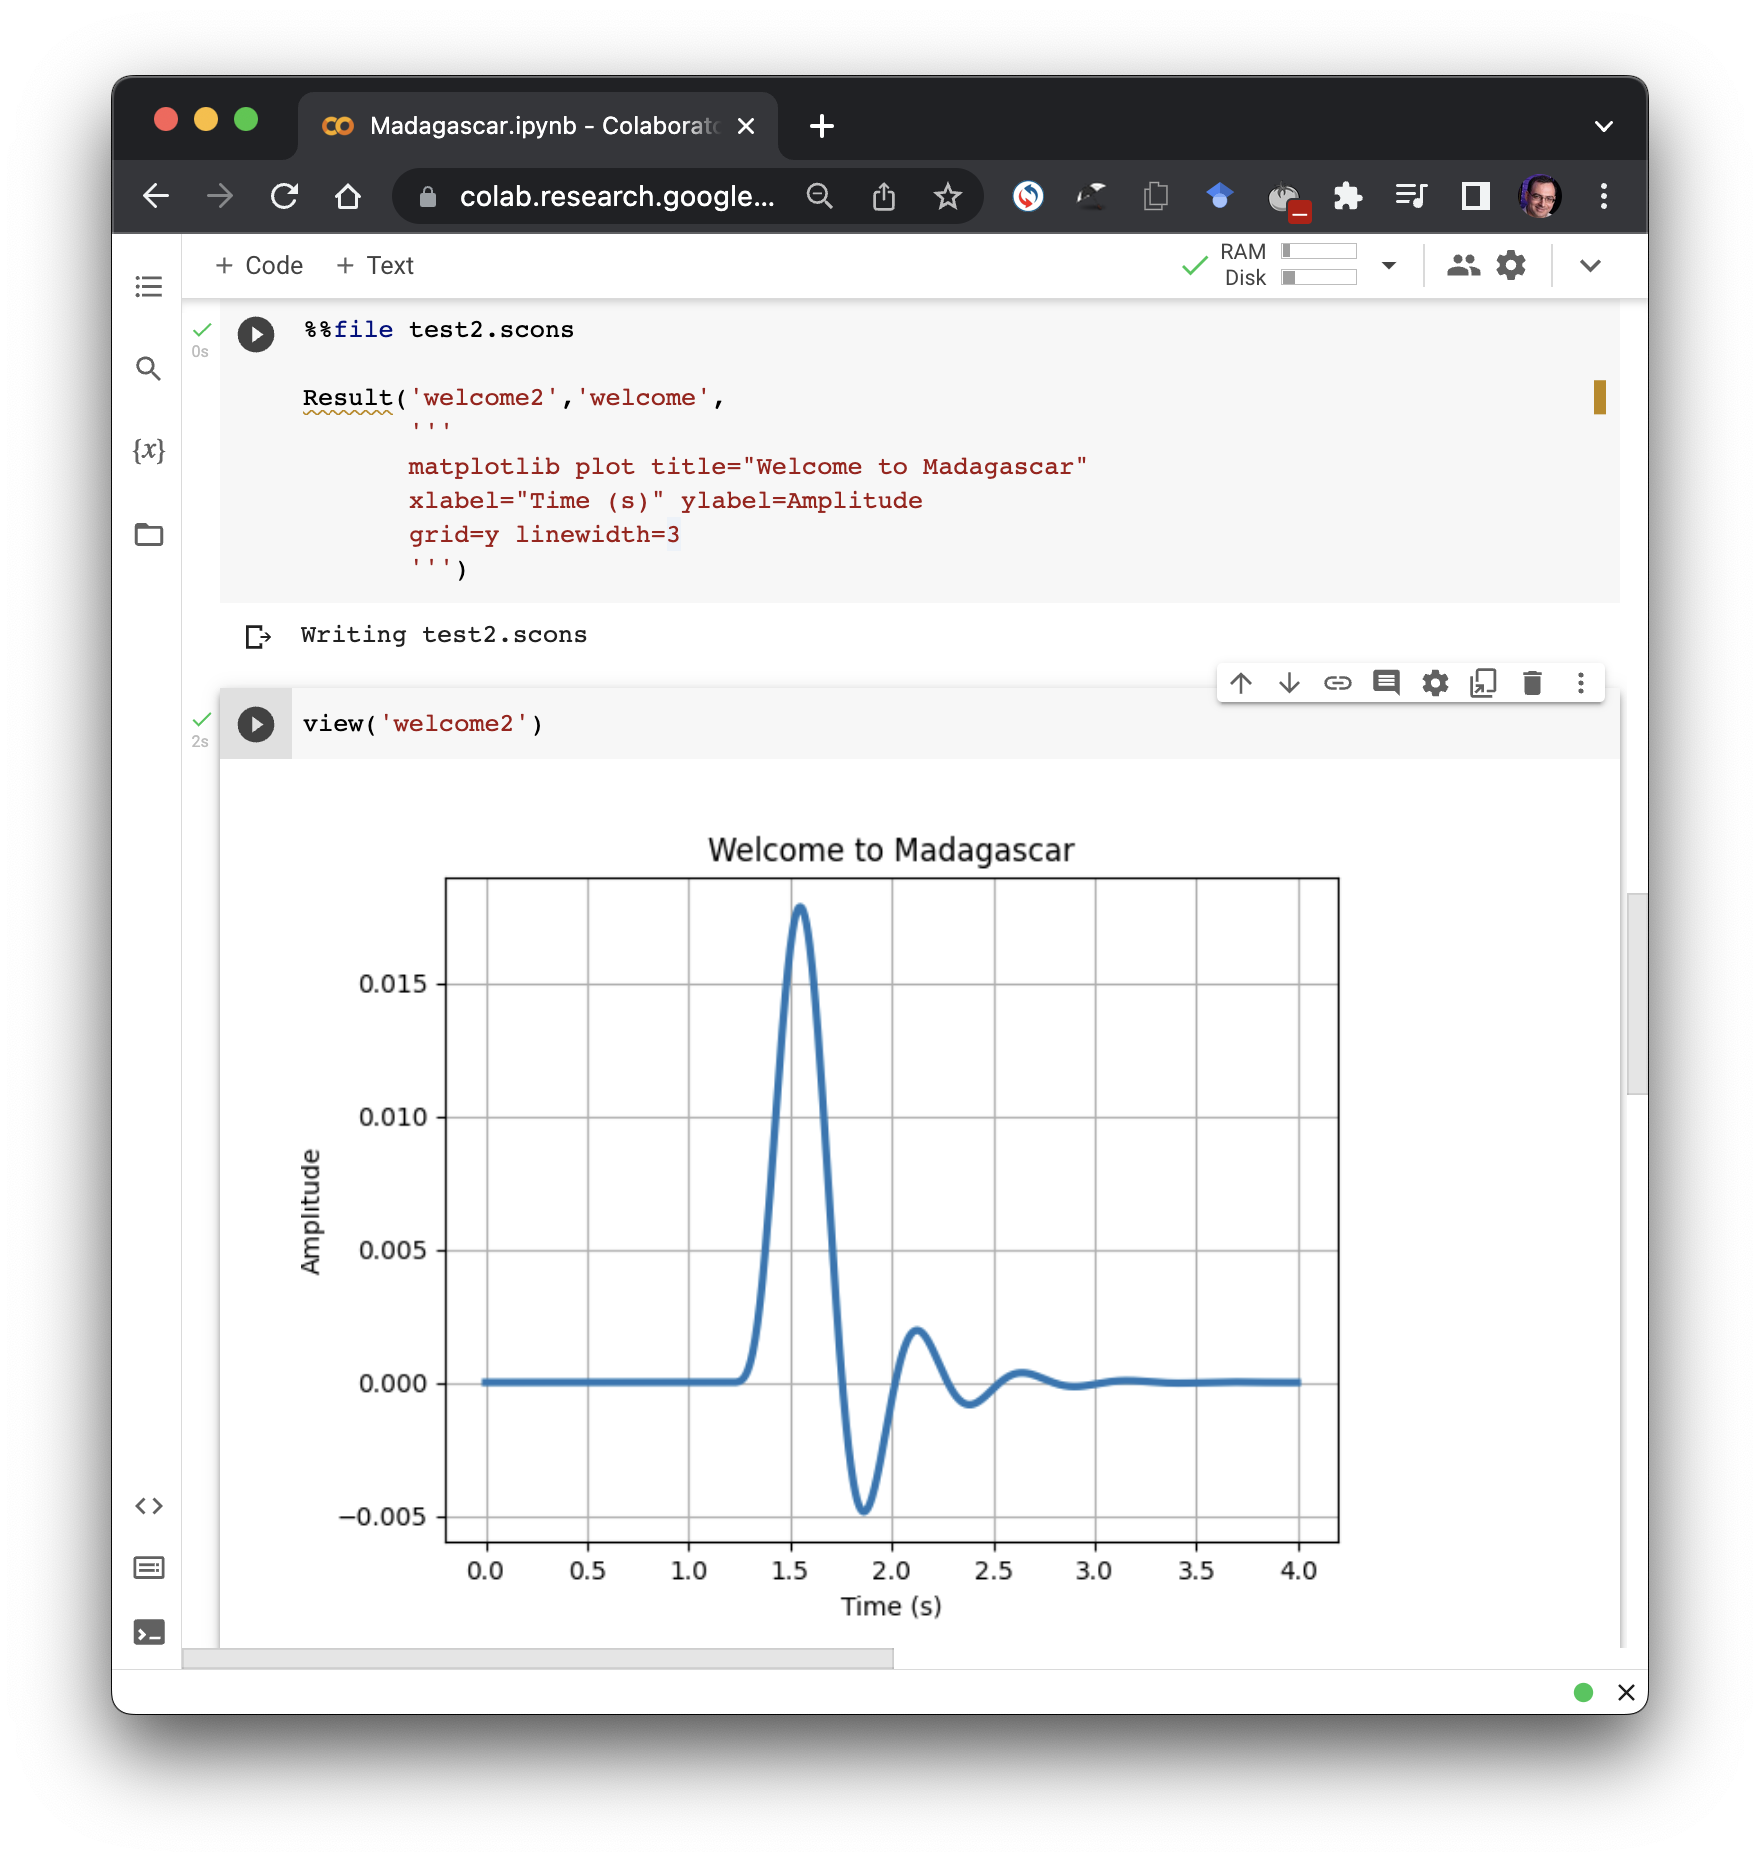
  • Plotting with Matplotlib may offer some advanced functionality in comparison with Vplot, such as the possibility of using $\LaTeX$ code in figure labels. It is now possible to use Matplotlib plots in papers reproducible with Madagascar through an application of sfmatplotlib. The figures will be saved in the PDF format and included in reproducible papers in the usual way. See an example.

The main advantage of continuing to use Vplot is the availability of sfvplotdiff, a key tool for reproducibility testing and continuous integration.

Madagascar users are invited to try the new functionality and contribute to its further development.

Vplot figures and MS Word

March 16, 2016 Systems No comments

Joe Dellinger, the author of Vplot, suggests adjusting parameters for raster figures when including them in Word documents. He writes:

Wow, working on my SEG abstract I had a helluva time getting my vplot raster figures to look decent in word. Then I realized… wait a minute, it’s doing just the bad things plotters back in the 80’s were doing. I fiddled a little with pixc and greyc, and voila! Beautiful raster figures.

From the Vplot documentation:

  • pixc is used only when dithering is being performed, and also should only be used for hardcopy devices. It alters the grey scale to correct for pixel overlap on the device, which (if uncorrected) causes grey raster images to come out much darker on paper than on graphics displays.

  • greyc is used only when dithering is being performed, and really should only be used for hardcopy devices. It alters the grey scale so that grey rasters come out on paper with the same nonlinear appearance that is perceived on display devices.

The default values are pixc=1 greyc=1. The values used by Joe in his Word document were pixc=1.15 greyc=1.25.

To convert Vplot plots to other forms of graphics, you can use vpconvert.

See also:

Continuous reproducibility using CircleCI

February 20, 2016 Systems No comments

Continuous Integration (CI) is a powerful discipline of software engineering, which involves a shared code repository, where developers contribute frequently (possibly several times per day), and an automated build system which includes testing scripts.

As previously suggested, CI tools can be easily adopted to perform continuous reproducibility: repeatedly testing if previously reproducible results remain reproducibe after software changes. Continuous reproducibility can assure that reproducible documents stay “alive” and continue to be usable.

Numerous tools have appeared in recent years to offer CI services in the cloud: Travis CI, Semaphore, Codeship, Shippable, etc. It is hard to choose one. I would pick CircleCI. CircleCI is developed by a startup company from San Francisco. Its product is not fundamentally different from analogous services but provides a solid implementation, which includes:

  • Integration with GitHub
  • SSH access
  • Sleek user interface
  • Simple configuration via circle.yml file
  • Fast parallel execution

Let us test if it can serve as a good platform for Madagascar’s continuous reproducibility.

Julia

September 28, 2015 Systems No comments

Julia is a new open-source programming/scripting language designed for high-performance scientific computing. The goal is to combine the simplicity of Python with the performance approaching that of statically-compiled languages like C.

Julia has a number of other attractive features including:

  • Dynamic type system
  • Powerful shell-like capabilities for managing other processes
  • Designed for parallelism and distributed computation
  • Automatic generation of efficient, specialized code for different argument types
  • Elegant and extensible conversions and promotions for numeric and other types

A simple interface to Julia has been added to Madagascar. It can be easily extended to include other functions from the Madagascar library. An example test script is shown below:

#!/usr/bin/env julia

using m8r

m8r.init()
inp = m8r.input("in")
out = m8r.output("out")

n1 = m8r.histint(inp,"n1")
n2 = m8r.leftsize(inp,1)

clip = m8r.getfloat("clip")

trace = Array(Float32,n1)

for i2 in 1:n2
    m8r.floatread(trace,n1,inp)
    trace = clamp(trace,-clip,clip)
    m8r.floatwrite(trace,n1,out)
end

Compare it with scripts or programs in other languages.

More colormaps

July 12, 2015 Systems No comments

The most popular colormap in Madagascar, other than the default greyscale, is color=j, modeled after “jet“, which used to be the default colormap in MATLAB. More than 1,000 Madagascar examples use color=j. In October 2014, with release R2014b (Version 8.4), MATLAB switched the default colormap to a different one, called “parula“. The “parula” colormap is copyrighted by MathWorks as a result of a creative process (solving an optimization problem). No open-source license is given to use it outside of MATLAB. According to Steve Eddins, “this colormap is MathWorks intellectual property, and it would not be appropriate or acceptable to copy or re-use it in non-MathWorks plotting tools.” Stéfan van der Walt and Nathaniel Smith from the Berkeley Institute for Data Science have developed several new open-source colormaps with good perceptual properties. One of them (named “viridis“) is proposed as a good replacement for “jet” and as the default colormap in matplotlib 2.0. 
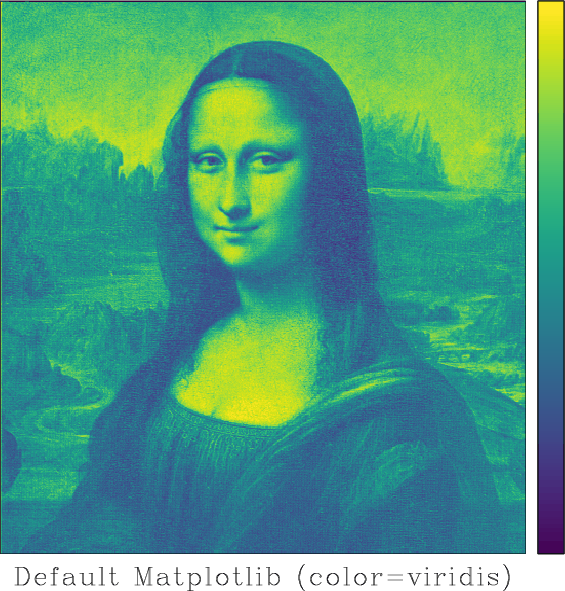
Is it a good colormap? We can find out by using tools from Matteo Niccoli’s tutorial on colormaps. 
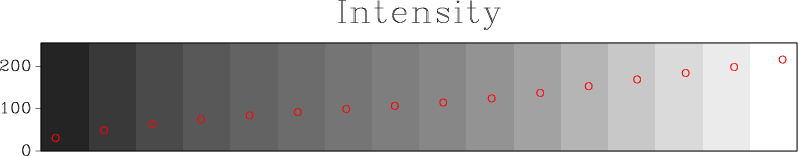
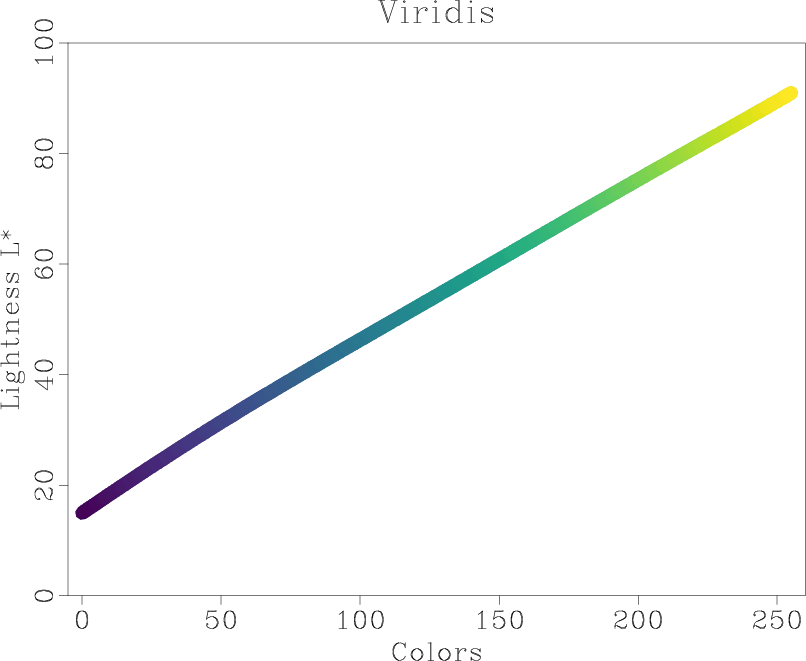
This analysis shows the intensity and lightness distributions of “viridis” are nicely linear. In his presentation at SciPy-2015, Nathaniel Smith explains the rational for this choice.

Reproducible research and PDF files

June 21, 2015 Systems No comments

Claerbout’s principle of reproducible research, as formulated by Buckheit and Donoho (1995), states:

An article about computational science in a scientific publication is not the scholarship itself, it is merely advertising of the scholarship. The actual scholarship is the complete software development environment and the complete set of instructions which generated the figures.

The geophysics class in the SEGTeX package features a new option: reproduce, which attaches SConstruct files or other appropriate code (Matlab scripts, Python scripts, etc.) directly to the PDF file of the paper, with a button under every reproducible figure for opening the corresponding script. Unfortunately, not every PDF viewer supports this kind of links. The screenshot below shows evince viewer on Linux, where clicking the button opens the file with gedit editor.

Literate programming with IPython notebooks

June 2, 2015 Systems No comments

Donald KnuthLiterate programming is a concept promoted by Donald Knuth, the famous computer scientist (and the author of the Art of Computer Programming.) According to this concept, computer programs should be written in a combination of the programming language (the usual source code) and the natural language, which explains the logic of the program.

When it comes to scientific programming, using comments for natural-language explanations is not always convenient. Moreover, it is limited, because such explanations may require figures, equations, and other common elements of scientific texts. IPython/Jupyter notebooks provide a convenient tool for combining different text elements with code. See the notebook at https://github.com/sfomel/ipython/blob/master/LiterateProgramming.ipynb for an example on how to implement literate programming using an IPython notebook with reproducible SConstruct data-analysis workflows in Madagascar.

Related posts:
* Madagascar in the cloud
* Reproducible research and IPython notebooks

Madagascar Virtual Machine Released

November 26, 2014 Systems No comments

As an alternative to installing Madagascar, you can now run a Crunchbang (Debian) virtual machine (VM) with it pre-installed. Just download, unzip, and run the file with Oracle VirtualBox (free software). Detailed instructions for running the VM for the first time or installing VirtualBox can be found in the readme.
Downloads:
README.txt
MadagascarVM.zip (~3.0 GB)
MadagascarVM.7z (~2.1 GB, but requires 7zip to unpack)

Madagascar in the cloud

July 10, 2014 Systems No comments

SageMathCloud is a free cloud computing platform for computational mathematics created by William Stein, the leader of the Sage project.

SageMathCloud provides a rich environment, which allows one, for example, to easily install Madagascar and to access it interactively through its Python interface. The example above shows Madagascar running interactively in the cloud using an IPython notebook hosted by SageMathCloud. Support for interactive widgets is a new feature in IPython version 2 released earlier this year.

See also: