The most popular colormap in Madagascar, other than the default greyscale, is color=j, modeled after “jet“, which used to be the default colormap in MATLAB. More than 1,000 Madagascar examples use color=j. In October 2014, with release R2014b (Version 8.4), MATLAB switched the default colormap to a different one, called “parula“. The “parula” colormap is copyrighted by MathWorks as a result of a creative process (solving an optimization problem). No open-source license is given to use it outside of MATLAB. According to Steve Eddins, “this colormap is MathWorks intellectual property, and it would not be appropriate or acceptable to copy or re-use it in non-MathWorks plotting tools.” Stéfan van der Walt and Nathaniel Smith from the Berkeley Institute for Data Science have developed several new open-source colormaps with good perceptual properties. One of them (named “viridis“) is proposed as a good replacement for “jet” and as the default colormap in matplotlib 2.0. 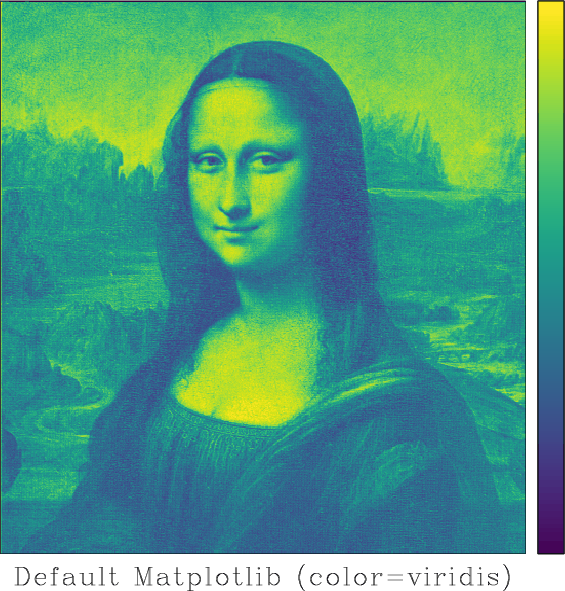 Is it a good colormap? We can find out by using tools from Matteo Niccoli’s tutorial on colormaps.
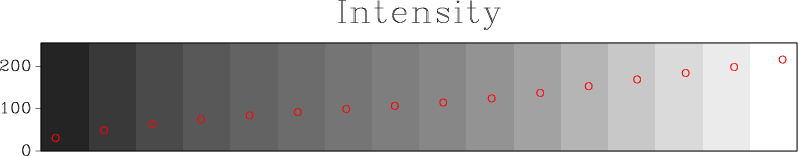
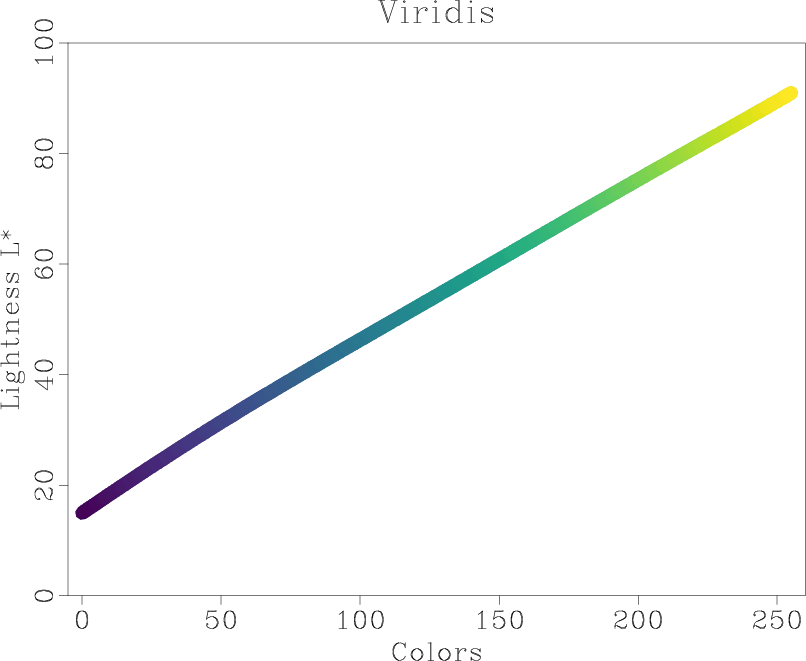
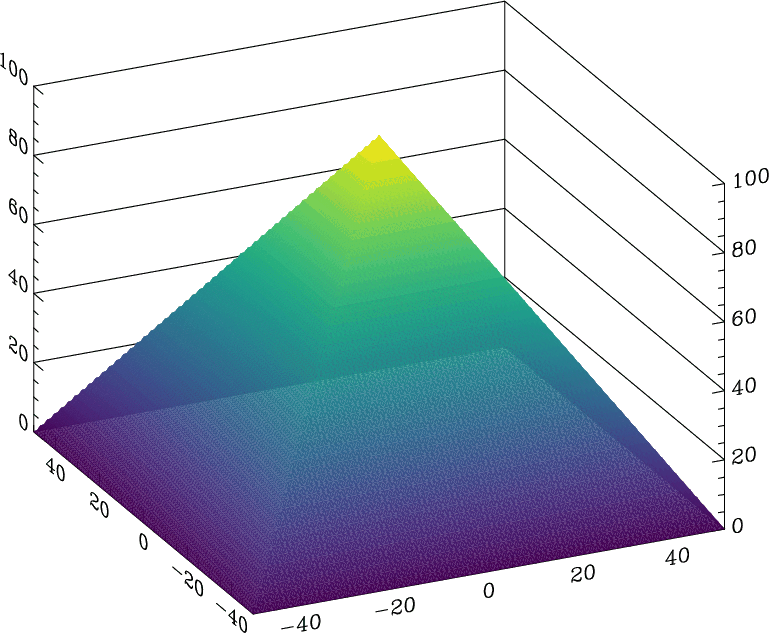 This analysis shows the intensity and lightness distributions of “viridis” are nicely linear. In his presentation at SciPy-2015, Nathaniel Smith explains the rational for this choice.
July 12, 2015 Systems
codemore code
~~~~