|
|
|
|
Time-frequency analysis of seismic data using local attributes |

|
|---|
|
s-2,st-2,proj-2
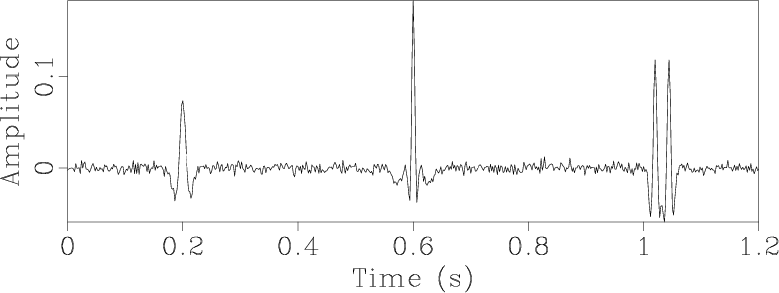
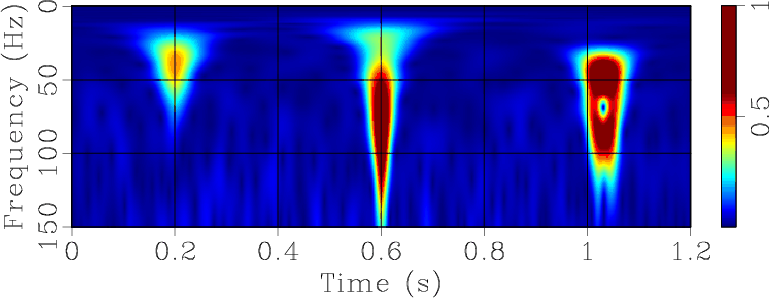
Figure 6. (a) Synthetic seismic trace. (b) Time-frequency map of the S-transform. (c) Time-frequency map of the proposed method. |
|
|
A synthetic seismic trace (Figure 6a) was obtained by adding Ricker wavelets with different frequencies and time shifts. The first event is an isolated wavelet with a frequency of 30 Hz, and the second event consists of a 15-Hz wavelet and a 60-Hz wavelet overlapping in time. The last event is a superposition of two 50-Hz wavelets with different arrival times. Figure 6b and 6c show the time-frequency maps by the S-transform and our method with 15-point smoothing radius, respectively. From the time-frequency map of the first event at 0.2 s, we found that time duration is long at low-frequency in the S-transform. The proposed method produces a more temporally limited ellipsoid spectrum for the first event. Note that the proposed method has higher spatial resolution at 0.6 s and temporal resolution at 1 s. This simple test shows that our method can be effective in representing
|
|
|
|
Time-frequency analysis of seismic data using local attributes |