|
|
|
|
Random lines in a plane |
Locally, seismic data is a superposition of plane waves. The statistical properties of such superpositions are relevant to geophysical estimation and they are not entirely obvious.
Clearly, a planar wave can be constructed from a planar
distribution of point sources.
Contrariwise, a point source can be constructed from
a superposition of plane waves going in all directions.
We can represent a random wave source either as a superposition
of points or as a superposition of plane waves.
Here is the question:
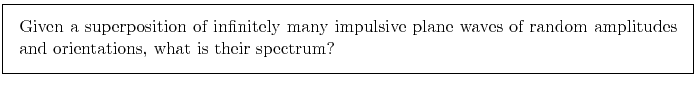
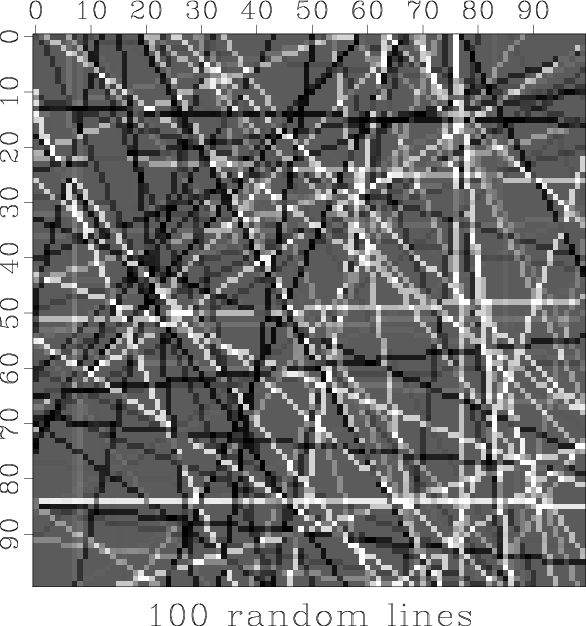
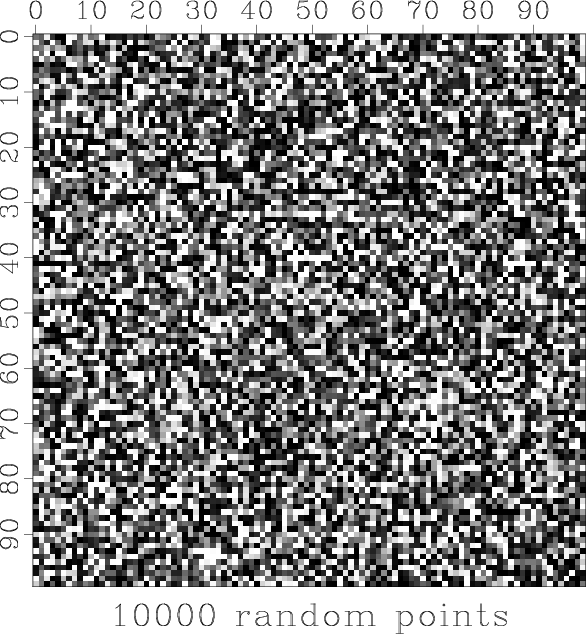
If you said the spectrum is white, you guessed wrong. Figure 1 shows that it does not even look white.

|
|---|
|
lines100,lines10000,randpt
Figure 1. Top shows a superposition of 100 randomly positioned lines. Middle shows a superposition of 10,000 such lines. Bottom shows a superposition of 10,000 random point values. The bottom panel shows the most high frequency. Its spectrum is theoretically white. This paper claims that the middle panel is more representative of natural noises. |
|
|
|
|
|
|
Random lines in a plane |