next up previous [pdf]

Next: Conclusions Up: Liu etc.: - - Previous: 3D prestack French model

Field data test

For the field data test, we use a time-migrated seismic image from Liu and Chen (2013). The input is shown in Figure 11. The three sections in Figure 11 show the time slice at time position of 0.34 s (top section), X line section at Y space position of 7.62 km (bottom left section), and Y line section at X space position of 1.41 km (bottom right section). The datacube displays simple plane layers above 1.0 s and complex structure below 1.0 s. Noise is mainly strong random noise caused by the surface conditions in this area. For comparison, we apply $ f$ -$ x$ -$ y$ NRNA to remove the random noise. We use a total of 24 neighboring traces around each output trace after applying a Fourier transform along time axis. The denoised result is shown in Figure 12, which gives a much clearer lateral continuity than original field data. $ f$ -$ x$ -$ y$ NRNA improves the both shallow plane events and deep dipping events. Figure 14 shows the difference section, in which the processed data using $ f$ -$ x$ -$ y$ NRNA have been subtracted from the original data. Some horizontal events are shown in Figure 14, especially at locations from 0.3 s to 1.0 s in Y line section (bottom right section). Figure 13 shows that the proposed $ t$ -$ x$ -$ y$ APF method also produces reasonable result, where continuity of events and geology structure are enhanced, and there is little noise left. The $ t$ -$ x$ -$ y$ APF parameters correspond to 5 (time) $ \times$ 4 (X) $ \times$ 4 (Y) coefficients for each sample ($ M$ =2, $ N$ =2, and $ L$ =2 in Equation 6 and 7) and 20-sample (time), 10-sample (X), and 10-sample (Y) smoothing radius for regularization operator $ \mathbf{R}$ . After carefully comparing with the filtering result of 3D $ f$ -$ x$ -$ y$ NRNA (Figure 12), 3D $ t$ -$ x$ -$ y$ APF (Figure 13) can be seen to preserve more detailed structure because $ t$ -$ x$ -$ y$ APF has extra nonstationarity along time axis while $ f$ -$ x$ -$ y$ NRNA only consider nonstationarity along the two space axis. Splitting into windows can partly help $ f$ -$ x$ -$ y$ NRNA to improve the result, but it still cannot provide a naturally nonstationary domain. Comparing with Figure 14, the difference (Figure 15) between Figure 11 and Figure 13 shows no obvious horizontal events and random noise is more uniformly-distributed.

data
data
Figure 11.
3D field data.
[pdf] [png] [scons]

tpre1
tpre1
Figure 12.
The denoised result by using 3D $ f$ -$ x$ -$ y$ NRNA.
[pdf] [png] [scons]

ppred3
ppred3
Figure 13.
The denoised result by using 3D $ t$ -$ x$ -$ y$ APF.
[pdf] [png] [scons]

diff3d
diff3d
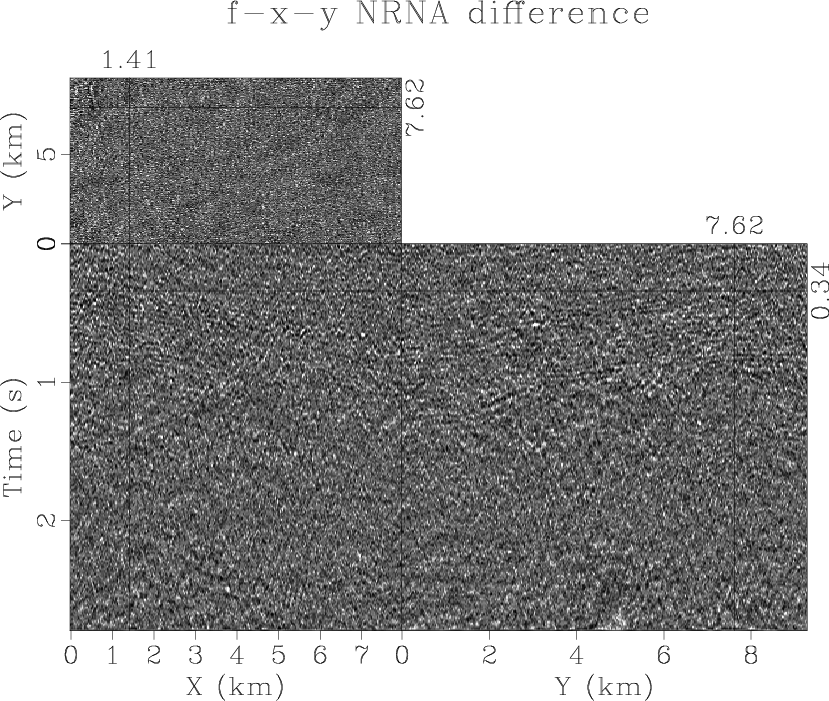
Figure 14.
The difference between the noisy data (Figure 11) and the denoised result by using 3D $ f$ -$ x$ -$ y$ NRNA (Figure 12).
[pdf] [png] [scons]

diff3
diff3
Figure 15.
The difference between the noisy data (Figure 11) and the denoised result by using 3D $ t$ -$ x$ -$ y$ APF (Figure 13).
[pdf] [png] [scons]


next up previous [pdf]

Next: Conclusions Up: Liu etc.: - - Previous: 3D prestack French model

2014-12-07